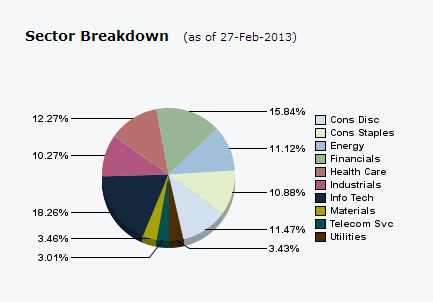
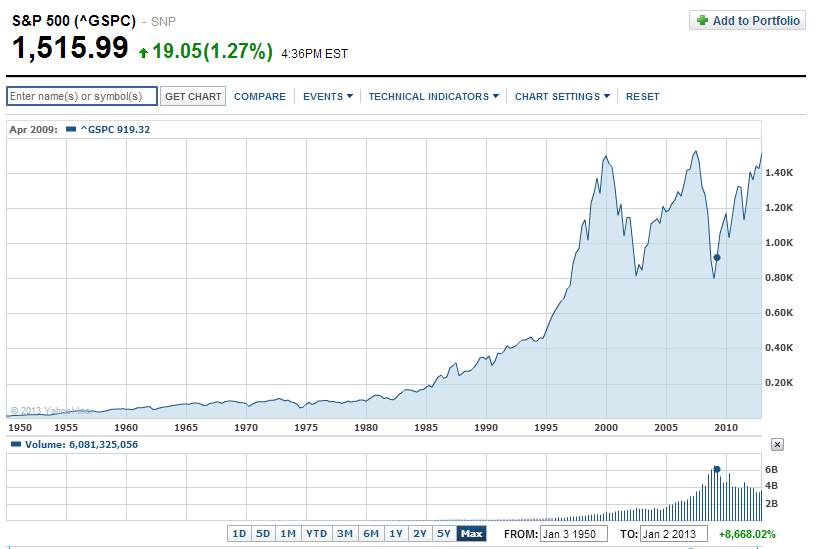
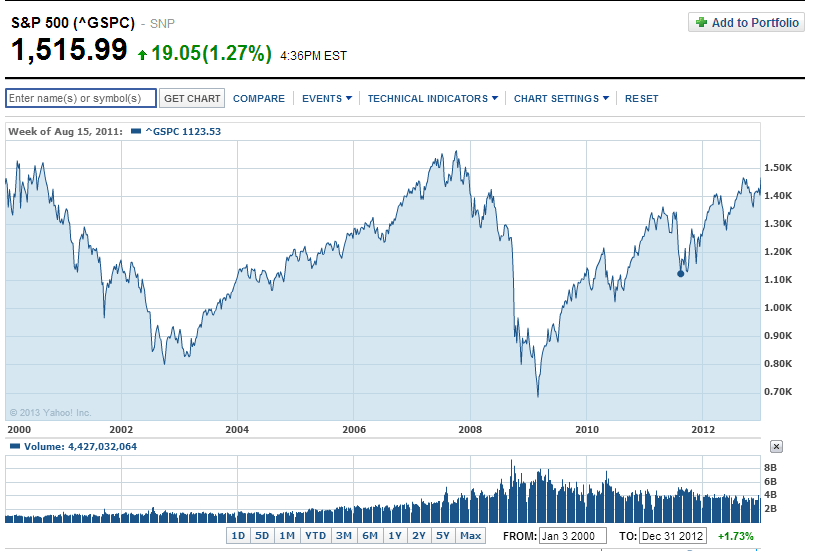
Markets have been volatile in the days since the Dow and S&P 500 almost reached their all-time highs recently. In the past couple of days the markets are more volatile supposedly due to the election mess in Italy and revived fears of the Euro collapse. According Jan Luthman of co-manager of the Liontrust Macro Equity Income fund in UK markets are resilient and that the uncertainty in Italy is unlikely to derail global economic recovery. He stated :
Europe is only 18 per cent of the global economy; much of the other 82 per cent is doing rather well.
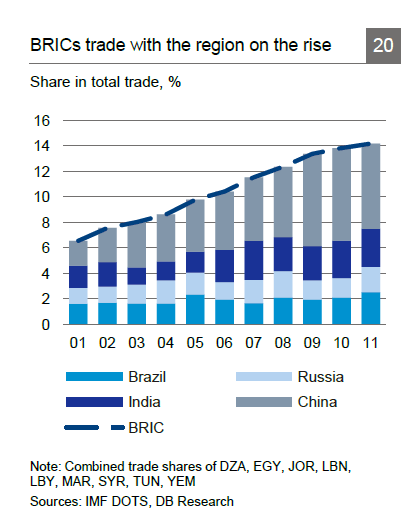
One way to take shelter from the European and developed world economic issues is to diversify into emerging market stocks. Though correlations between emerging and developed markets have increased in the past few years, emerging markets are still more influenced by domestic factors as opposed to say Italian elections. Since many emerging economies are doing well it is wise to invest in emerging equities.
Ten randomly selected Latin American stocks are listed below with their current dividend yields for consideration:
1.Company: Copa Holdings SA (CPA)
Current Dividend Yield: 2.16%
Sector: Airline
Country: Panama
2.Company: Credicorp Ltd (BAP)
Current Dividend Yield: 1.56%
Sector: Banking
Country: Peru
3.Company: Empresa Nacional de Electricidad SA (EOC)
Current Dividend Yield: 2.95%
Sector: Electric Utilities
Country: Chile
4.Company: CPFL Energia SA (CPL)
Current Dividend Yield: 7.51%
Sector: Electric Utilities
Country: Brazil
5.Company: Fomento Economico Mexicano SAB de CV (FMX)
Current Dividend Yield: 1.22%
Sector: Beverages (Nonalcoholic)
Country: Mexico
6.Company: Administradora de Fondos de Pensiones Provida SA (PVD)
Current Dividend Yield: 7.07%
Sector: Investment Services
Country: Chile
7.Company: Banco Latinoamericano de Comercio Exterior SA (BLX)
Current Dividend Yield: 5.00%
Sector: Banking
Country: Panama
8.Company: Union Andina de Cementos SAA (CEMTY)
Current Dividend Yield: 1.40%
Sector: Construction – Raw Materials
Country: Peru
9.Company: Banco Santander-Chile (BSAC)
Current Dividend Yield: 3.99%
Sector: Banking
Country: Chile
10.Company: Petrobras Argentina SA (PZE)
Current Dividend Yield: 4.22%
Sector: Oil & Gas – Integrated
Country: Argentina
Note: Dividend yields noted are as of Feb 26, 2013
Disclosure: No Positions
