Banks in Cyprus opened today after being closed for 12 days due to the ongoing crisis. The most anticipated event of the crisis – namely a good old-fashioned bank run – did not occur. Instead it appears that this Cyprus drama will drag for a few months.
The tiny island of Cyprus was thrown in the international spotlight a few days ago. Up until that moment investors and everyone else were focused on PIIGS for many months. Indeed the poorest country in Europe but known for being the birthplace of democracy, Greece dominated the media for years in a row requiring multiple bailouts and is still struggling to get its act together. Portugal and Spain faded off with their crises solved one way or another. Italy has been in the news recently as it is still trying to put its political and fiscal situation back in order.
Similar to other bailed-out countries, the worst culprit to cause the crisis in Cyprus are the banks.The island’s tiny banks took in huge amounts in deposits from Russian oligarchs and local people alike. But instead of running the bank conservatively like banks are run in emerging and frontier countries, as an EU member Cyprus gambled heavily on Greek bonds and other high-risk investments leading to this crisis. The good thing about this crisis is that Cyprus is not a major economy in Europe and hence the crisis will be contained sooner or later.
When I was browsing through the top global banks that sustained the most losses last year I noticed two Cypriot banks appear among the top 25 banks.
Click to enlarge
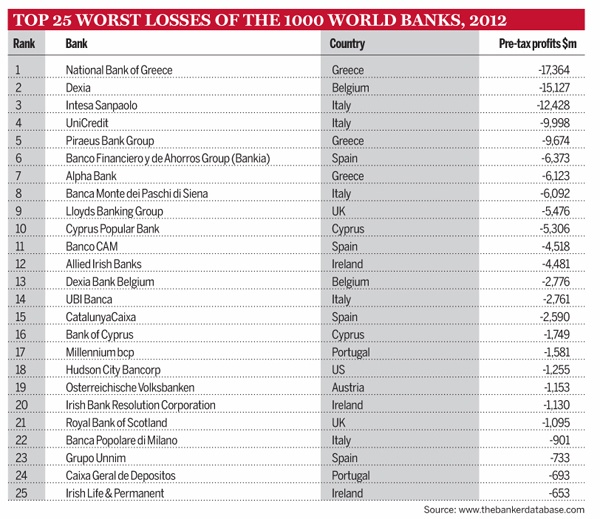
Source: The Banker
Cyprus Popular Bank and Bank of Cyprus are in the above chart.When this list was first published last July I did not realize that Cyprus would one day revive the perpetual European sovereign debt crisis.
All the banks in the above list are European banks with the exception of Hudson City Bancorp, Inc. (HCBK) of the U.S. Among the major British Llyods Banking Group (LYG) and Royal Bank of Scotland(RBS) were the worst performers and are still a long way to go from reaching their pre-crisis levels. Investors are better off avoiding these two banks like the plague.
Disclosure: Long LYG