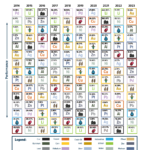
The annual S&P sector performance chart for the year ending in 2022 was published by Novel Investor this week. This is based on total returns. In 2022, the top performer was the energy sector with an annual return of over 65% followed by utilities. With the S&P 500 in bear market, most of the traditionally strong sectors during bear markets such as utilities, consumer staples, health and industrials performed relatively well to the worst hit sectors such as tech and telecom.
Overall the key takeaway from the chart is that diversification is important for success with equity investing. No sector is best performer year after year forever. The best performer in one year can easily end up as the worst the following year.
Click to enlarge
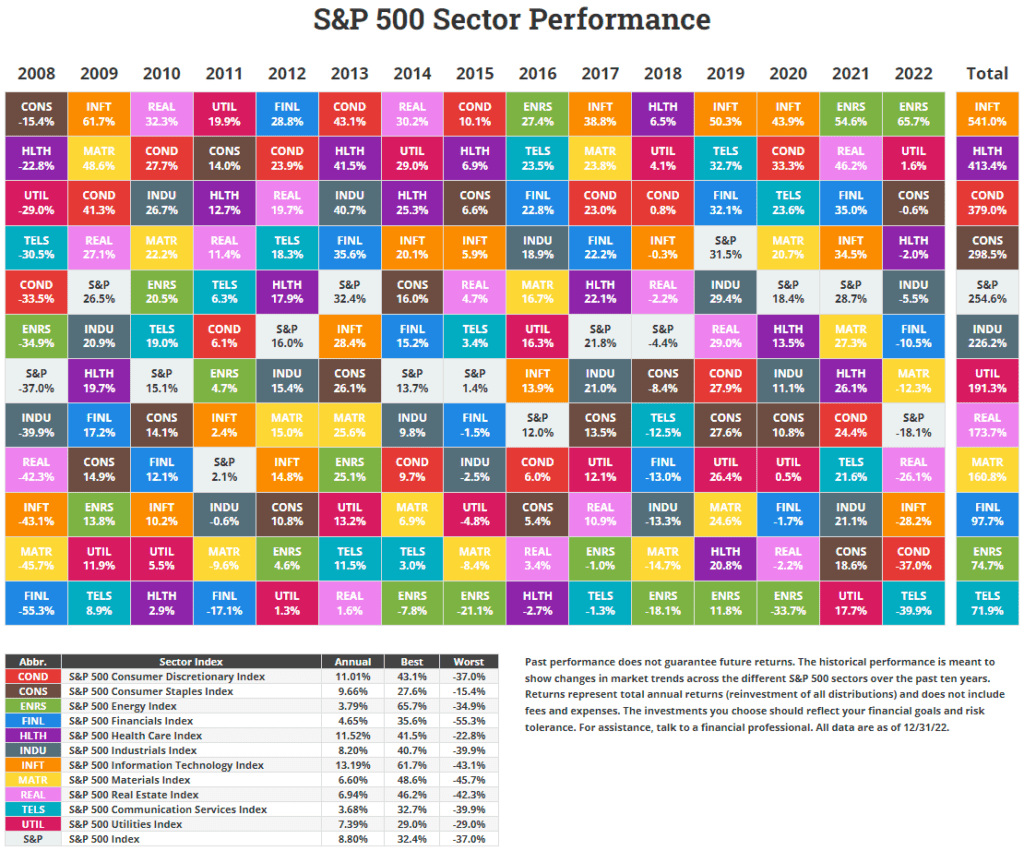
Source: Novel Investor
Related ETFs:
- SPDR S&P 500 ETF (SPY)
- iShares Core S&P 500 ETF (IVV)
- Vanguard S&P 500 ETF (VOO)
- SPDR Portfolio S&P 500 ETF (SPLG)
The Complete List of Constituents of the S&P 500 Index can be found here.
Disclosure: No positions
