Timing the market is not a good idea for most investors. Following this strategy is especially detrimental to long-term investors. Short-term investors also should avoid this strategy since even shorter time periods timing the market usually leads to lower returns. Investors holding equities for less than five years can be considered as short-term investors.
Proponents of this theory would argue that this is a great concept to follow and that buy-and-hold does not work anymore. With things like algorithms-based trading, high-frequency trading, high number of hedge funds in existence, never-ending macro-economic crises, etc. it would seem that buying and selling at the market bottoms and peaks may be the best way to make money in this market. For example, supporters of this theory may support their case with a chart like the one below:
Click to enlarge
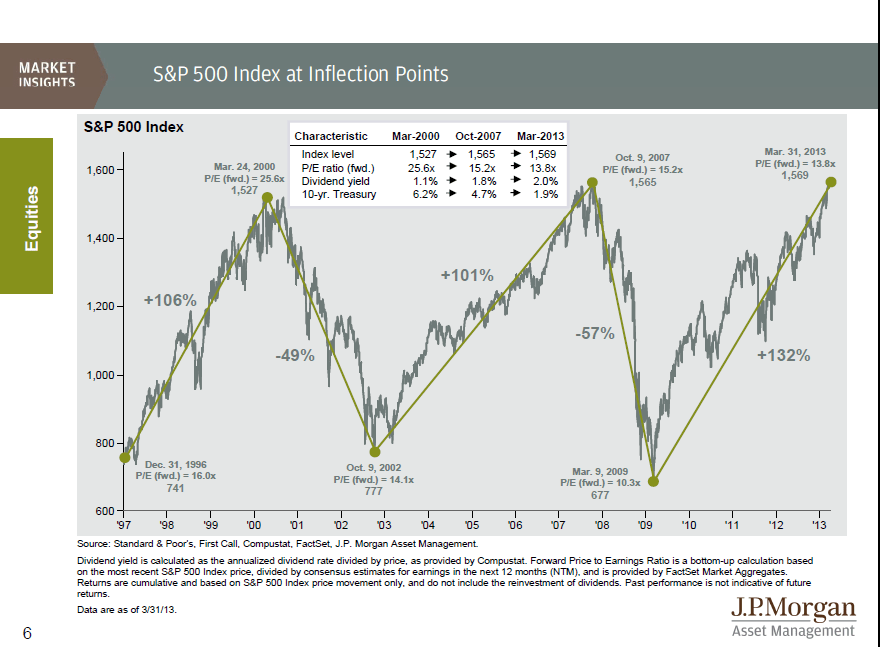
Source: Guide to the Markets, 2Q 2013, JP Morgan Asset Management
Though the chart looks pretty, in reality it is impossible for any investor to perfectly identify the market tops or bottoms and trade accordingly. In fact, majority of the investors missed the current bull market that started from early 2009 at the peak of the financial crisis.
Many research studies have proven that market timing does not work. Here is the result of a new study by Fidelity, UK:
Analysis by fund managers Fidelity found that if you invested £10,000 across all FTSE companies over the past 15 years and just left it there, you would have £19,610 today.
But if you missed the best ten days trying to second-guess the rises and falls you would have £10,611. If you missed the best 40 days you would have just £3,554 — cutting your initial outlay by more than half.
One of the best performing equity income fund over the past 20 years in the UK is the £14 billion Invesco Perpetual High Income fund run by fund manager Neil Woodford. This fund holds high-quality dividend paying companies. One of the reasons for the Neil’s excellent consistent performance can be attributed to the fact that the fund’s major holdings have not changed much in the past 10 years. Some of the top holdings in the fund include AstraZeneca PLC (AZN),GlaxoSmithKline plc (GSK),Reynolds American Inc. (RAI) and British American Tobacco plc (BTI). The fund is up 32.3% in 1 year and 51.4% in 5 years in the local market.
Source: The Footsie’s had a stellar year, but will the great share boom turn to bust?, This is Money, UK
Disclosure: No Positions