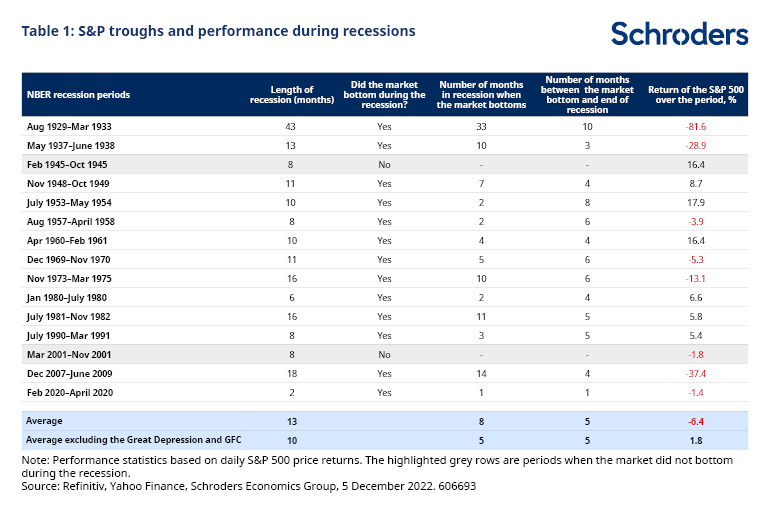
The twenties were known as the “Roaring Twenties” as the economic growth was in full swing in the country. However that did not last for long. On Monday, October 28, 1929 the Dow Jones crashed by 13 percent. From the peak of 1929 to the trough in 1932, the index plunged by an astonishing 89.2%. Many investors abandoned equities in droves and the market did not recover for years.
While such a huge decline is unlikely to happen nowadays it still pays to learn from history. The following graphic shows some of the optimistic views when the market crashed in 1929:
Click to enlarge
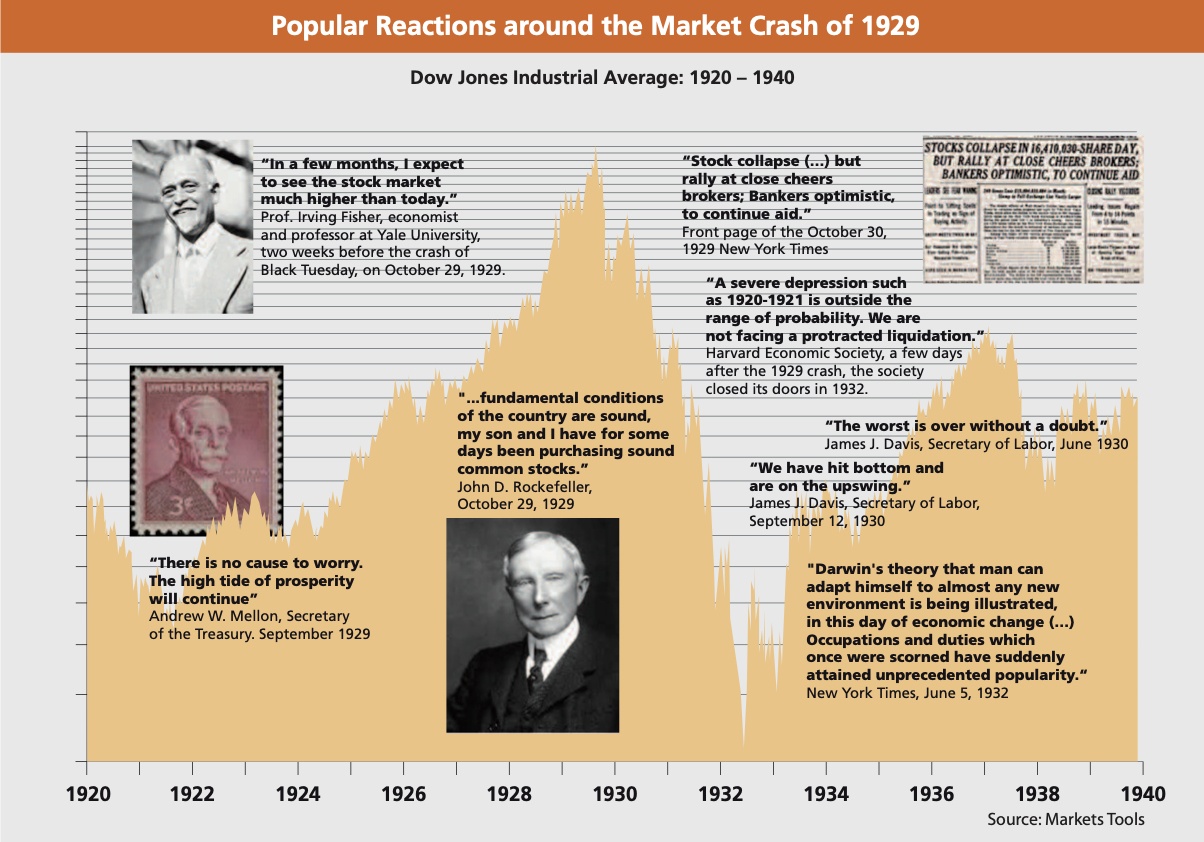
Source: Investment Office