Time for a change of approach in Europe?, Invesco Perptual
The problem with tennis in America, DNA
American decline has been exaggerated: Olive, The Star
Cable companies as robber barons (The Guardian)
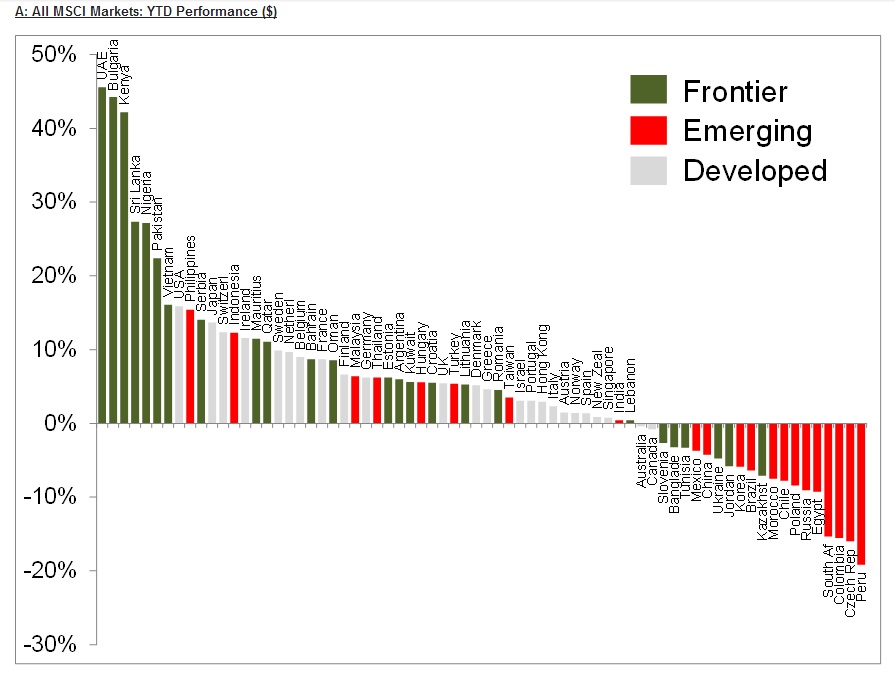
Why you should ignore the “slowdown” in emerging markets (Trustnet)
What Silicon Valley can teach Canadian businesses about ‘lean innovation’ (Financial Post)

Singa lion, Singapore