Five Reasons To Consider Chilean Stocks

Among the Latin American equity markets, the Chilean market does not get as much attention from international investors as other countries such as Brazil and Mexico do.However this need not be the case. The relatively smaller country of Chile offers many excellent investment opportunities.

Some of the reasons to consider buying Chilean stocks include:

1. Chile’s IPSA index is down 13.7% year-to-date as of Oct 9th while Brazil’s Bovespa is off by 13.8%. Despite the Chilean economy being in a better shape than Brazilian economy, investors are treating both the markets to be similar. Hence it can be argued that Chilean stocks are comparatively cheaper.

2. The P/E ratios of Brazil, Chile and Mexico are 15.8, 18.3 and 19.7 according to FT markets data. So there is room for some P/E expansion.

3.Chile has a budget surplus based on 2012 data as per the CIA’s The World Factbook.  Generally surplus countries are better for investment than deficit countries.

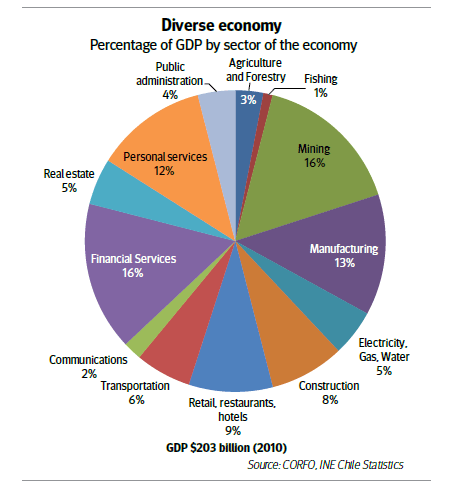
4.A common misconception of global investors is that the economy of Chile is mainly based on commodities especially copper. This is true in the sense that the mining sector brings the largest revenue for the country and is also the largest export-revenue earner. However the sector accounts for only 16% of the total economy. In fact Chile has a very diverse economy as shown in the chart below:

Click to enlarge
Chile-Economy

Source: Doing Business in Chile 2012, KPMG

So simply evaluating Chilean equities based on the price movement of copper and other commodities is not wise.

5.Chile has a highly attractive business environment with its low corporate income of 18.5% in 2012. The country’s GDP is projected to grow by a modest 4.6% this year and the unemployment rate is below 6%.

Five Chilean stocks trading on the US exchanges are listed below for further research:

1.Company: Compania Cervecerias Unidas SA (CCU)
Current Dividend Yield: 1.73%
Sector:Beverages

2.Company: Banco de Chile (BCH)
Current Dividend Yield: 3.73%
Sector:Banking

3.Company: Enersis SA (ENI)
Current Dividend Yield: 2.59%
Sector:Electric Utilities

4.Company: Vina Concha y Toro SA (VCO)
Current Dividend Yield: 1.65%
Sector:Beverages

5.Company: Empresa Nacional de Electricidad SA (EOC)
Current Dividend Yield: 1.69%
Sector:Electric Utilities

Note: Dividend yields noted are as of Oct 9, 2013. Data is known to be accurate from sources used.Please use your own due diligence before making any investment decisions.

Another simple and easy way to gain exposure to Chile is via the iShares MSCI Chile Capped ETF (ECH). It has an expense ratio of 0.61% and an annual dividend yield of 1.38%.

Disclosure: Long BCH, ENI

Knowledge is Power: Lazy Investors, Poland, Developed Markets Edition

Why your retirement plan won’t cut it (MarketWatch)

UK the place to be, says Jupiter Merlin team (Trustnet)

Emerging Asian economies expected to remain resilient but structural reform critical (OECD)

CP vs. CN Railway: Which is the better investment? (The Globe and Mail)

How to Stay on Track When Markets Are Volatile (Charles Schwab)

Inside investment: Greek lessons (EuroMoney)

Simple solutions for lazy investors (MoneyWeek)

Country Report: Poland (Global Finance)

Bank performance in the US and Europe – An ocean apart (DB Research)

Why developed markets (Fidelity)

DSC00746

Crude Oil Prices Chart From 1861 To 2012

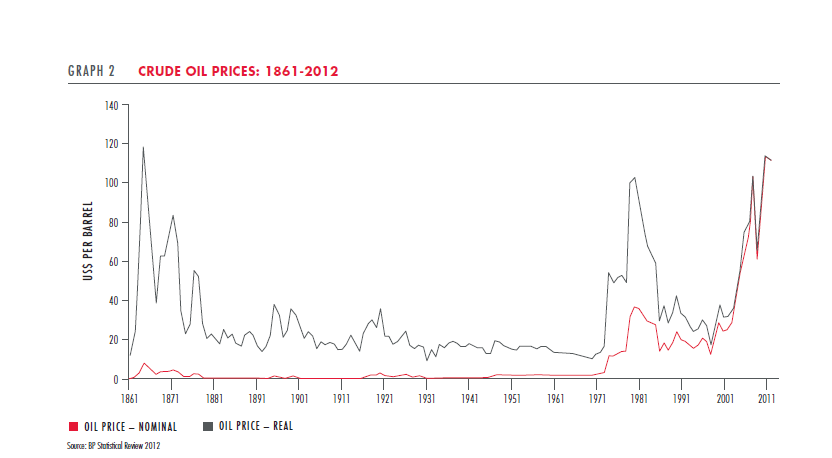
Crude oil prices(WTI) closed at $103.84 on Oct 4, 2013. Prices fell below $50.0 per barrel at the peak of the global financial crisis but has recovered to stay in the $100 range in the past few years.

The following chart shows crude oil prices in both nominal and real terms from 1861 to 2012:

Click to enlarge

Crude-Oil-Prices-1861-2012

Source: Sasol: A history of underestimation,  Rory Kutisker-Jacobson, Allan Gray

While prices remained stable for years after 1971 it took off. Since 2000 prices have soared to astronomical levels.

From the article:

The question then becomes: Why is the oil price high, and, more importantly, is a significant decline in the future likely?

Unlike many commodities, the oil market is somewhat unique in that the swing producer is one of the lowest cost producers. Roughly 43% of world production comes from the Organisation of the Petroleum Exporting Countries (OPEC), with Saudi Arabia being the largest producer. Saudi Arabia is also the only OPEC country with significant spare capacity. While the pure cost of extraction in Saudi Arabia is low, the vast majority of government revenue is derived from the sale of oil, which is used to subsidise other industries and social welfare. Current estimates are that Saudi Arabia needs an oil price of between US$90 and US$100 per barrel to balance its fiscal budget. It is in the Saudis’ best interests to manage the supply of oil to maximise their revenue per barrel without encouraging demand destruction.

The formation of cartels is illegal in all industries except OPEC. This cartel for the most part determines the price of oil in the global market.  Here is a definition of cartel from Wikipedia:

A cartel is a formal (explicit) “agreement” among competing firms. It is a formal organization of producers and manufacturers that agree to fix prices, marketing, and production.

It is interesting how countries such as Saudi Arabia are legally allowed to manipulate the prices in order to balance its budget.

Related ETFs:

  • United States Oil (USO)

Disclosure: No Positions

The Top Five Banks in Argentina Based on Tier 1 Capital

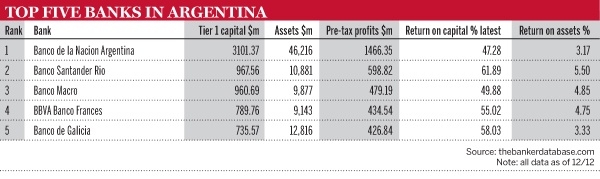
The Top Five Banks in Argentina based on Tier 1 Capital at the end of last year are listed below:

Click to enlarge

Top-5-banks-in-Argentina

Source: The Banker

Banco Macro(BMA) and BBVA Banco Frances (BFR) trade on the U.S. markets and both are up over 29% and 27% respectively YTD. Banco Macro has suspended its dividends and has not paid a dividend for the past two years. BBVA Banco Frances has also not paid a dividend since 2011.

Argentina is involved in a nasty fight with hedge fund primarily led by Elliott Management. An update at FT beyondbrics blog on this legal dispute notes that the U.S. Supreme court has not ruled on Argentina’s appeal after a lower court ruled in favor of the “vulture funds”. Meanwhile the legal saga may continue into next year.

Disclosure: Long BMA

Household Financial Assets By Asset Type Across Select OECD Countries

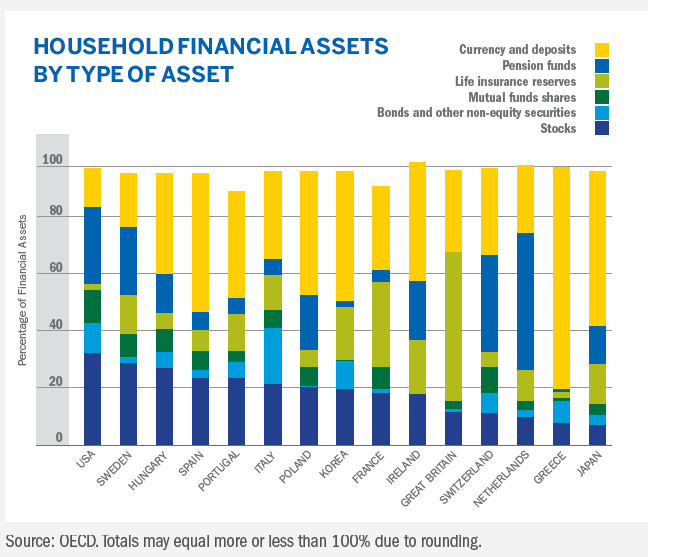
Financial assets held by households vary widely across countries. In the developed world, households hold a higher portion of their financial assets in equities compared to the emerging world where equities are not as popular for a variety of reasons. Among developed countries, the percentage of households’ financial assets held in various asset classes such as stocks, bonds, insurance, bank deposits, etc. varies from one country to another.

The following chart shows the household financial assets by type of assets held in select OECD countries:

Click to enlarge

Household-Fin-Assets-OECD-Countries

Source:  The Influence of Demographics on Stock Markets of Alejandra Grindal, Ned Davis Research, Inc. in onInvesting, Summer 2013, Charles Schwab

U.S. households hold the highest portion of their financial assets in individual stocks followed by Sweden. Japan has the lowest number of households invested in individual stocks. This is not surprising since ordinary Japanese have pretty much ignored their stock markets since the asset bubble collapse of the early 90s. Even today Japanese have one of the lowest stock market participation rates in the world despite a big run in the Nikkei due to Abenomics introduced the Prime Minister Shinzo Abe.

Since stocks are also present in mutual fund shares, life insurance reserves, and pension funds, Alejandra Grindal, Senior International Economist at Ned Davis Research, Inc estimates that equities make up about 50% of total household financial assets in the U.S.  Americans also hold the lowest percentage of their financial assets in cash relative to  Japan at 54%, Germany at 40% (not shown in chart) and the UK at 28%. German, French  and British households invest a high portion of their financial assets in life insurance policies. Hence it may be wise to invest in life insurers such as Legal & General Group Plc (LGGNY),  AXA Group (AXAHY) and Allianz SE (AZSEY).

For more details on stock  market participation rates globally you can checkout my article earlier this year.

Disclosure: Long AXAHY