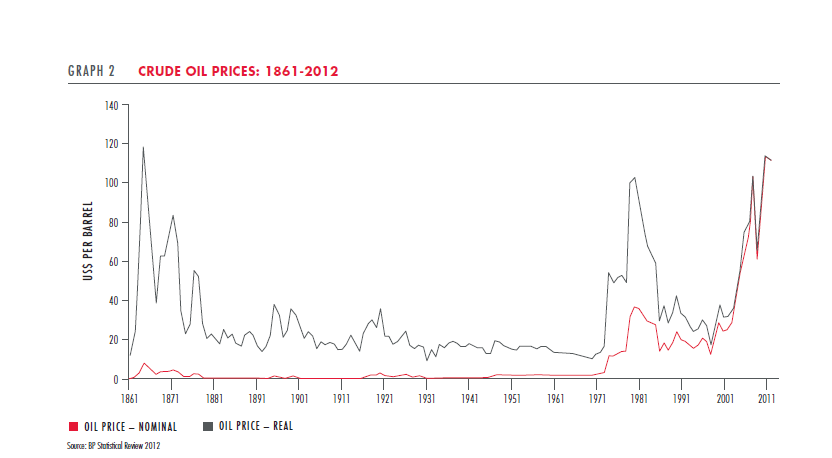
Knowledge is Power: Emerging Markets, German Mittelstand, Retirement Edition

Leeds and Liverpool Canal

Leeds and Liverpool Canal, UK

Health Care Expenditure As A Percentage Of GDP Among OECD Countries

Health Care Expenditure in the US as a share of GDP is the highest among OECD countries according to the Heath at a Glance 2015 report by the OECD. Some of the key findings from the report are listed below:

  • Life expectancy in the US is lower than in most other OECD countries due to several reasons including poor health-related behaviors such as drinking, obesity, etc. and the fragmented healthcare system in the country. Life expectancy in the US is 78.8 years in the US in 2013 compared with 80.5 years for the OECD average. In 1970 the US rate was one year higher than the OECD average. The growing gap between the US and other countries is due to many reasons, including prevelance of important risk factors to health and the fragmentation of the healthcare system with little resources devoted to public health and primary care.
  • The proportion of adults who smoke in the US is the lowest in OECD countries but alcohol consumption is rising and obesity rate is the highest. The rate has declined from 33.5% in 1980 to 14% in 2013.
  • The quality of acute care in hospital in the US is excellent. However the US health system is not performing well in avoiding admissions for people with chronic diseases.
  • Obesity rates among adults in the US are the highest among OECD countries, with 35% of adults being obese. Obesity is a known factor for many health problems.

The following chart shows that health spending in the US still far exceeds other OECD countries:

Click to enlarge

Global health expenditure Comparison by OECD

From the report:

Although health spending growth has slowed down considerably in recent years in the United States, it remains much higher on a per capita basis than in all other OECD countries, and was two-and-a-half times greater than the OECD average in 2013. The share of GDP allocated to health spending in the United States (excluding capital expenditure) was 16.4% in 2013, compared with an OECD average of 8.9%. This share has remained unchanged since 2009, as health spending growth matched economic growth.

Source: OECD

Related:

Knowledge is Power: Gold, Shining India, ETFs Due Diligence Edition

Old Car in UK Farm

Antique car in a UK Farm

Why You Should Own German Stocks

Germany is the largest economy in Europe and many German firms hold leadership positions at the global level in their respective fields. So when I came across an article that was way off on German stocks, I had to clarify a few issues. Fund manager and author Sven Carlin wrote a piece titled  The Case Against International Diversification: Trying To Find Good Stocks In Germany in Seeking Alpha recently. The author is incorrect on many points and few readers noted those in the comments section following the article.

Here is a summary of his article:

Due to many companies with negative earnings or high PE ratios and low growth, investing in German ETFs or index funds is not advised (especially small and mid cap).

The overvaluation of the German market is proved with companies like Zalando (PE=649) and Zooplus (PE=165) and the DAX average PE of 22.2.

Currency tailwinds aid German companies and I believe that a stronger euro would have a severe influence on their businesses.

A detailed comparison and inspection of German stocks shows that there are much better investments on the NYSE and Nasdaq.

After researching some German 447 stocks on various metrics the author came to the following conclusion:

Unfortunately not much has been found from my German research but sometimes it is good to know where not to go and not to invest. The currency tailwinds and the consequent future risks related to potential currency headwind plus the weaker fundamentals put me off from investing in Germany.

For long-term investors holding German equities is a no-brainer. Though German stocks may be volatile in short-term, they have returned positive returns in the long-term. The following fascinating chart shows the returns over various time periods:

Click to enlarge

DAX Retunrs By Year Long Term Chart

Source: Deutsches Aktieninstitut

From a Motley Fool article that explains the above chart:

Each individual box in the triangle shows the annual return for an investor who bought the DAX at the end of one year (Y-axis) and held through the end of another year (X-axis). Green boxes show gains, boxes closer to white show flat returns, and red boxes show losses.

First, take a moment to admire all the green in that chart. In the vast majority of years and time periods, the DAX has had a positive annual return.

Now look what happens as you move down and toward the right of the triangle. The red squares disappear completely. In plain language: The longer the holding period, the higher the chance of a positive annual return. In fact, you won’t find a single 15-year holding period in the entire 50-year span of the chart that doesn’t result in a positive annual return.

Even using 10 years as a holding period, there are only two instances (out of 41 possibilities) where your returns would have ended up negative. That means that if you bought the DAX any time over the last 50 years, and held for at least 10 years, you had a 95% chance of a positive annual return.

Source: Why you need to own stocks, Motley Fool Germany, 2014

All the green squares in the chart makes it clear that German equities have returned positive returns than negative returns in many time periods. The red concentration around 2008-09 and during the dot-com crash of 2000 are understandable. So though Sven Carlin concluded that he could not find German companies worth investing in, it misses the point big time. History has shown time and again that long-term investors are richly rewarded.

Some of the excellent companies that investors can consider are Adidas AG(ADDYY), Continental AG (CTTAY), Henkel (HENKY), Fresenius Medical Care AG(FMS) and Siemens Aktiengesellschaft (SIEGY)

Disclosure: No Positions