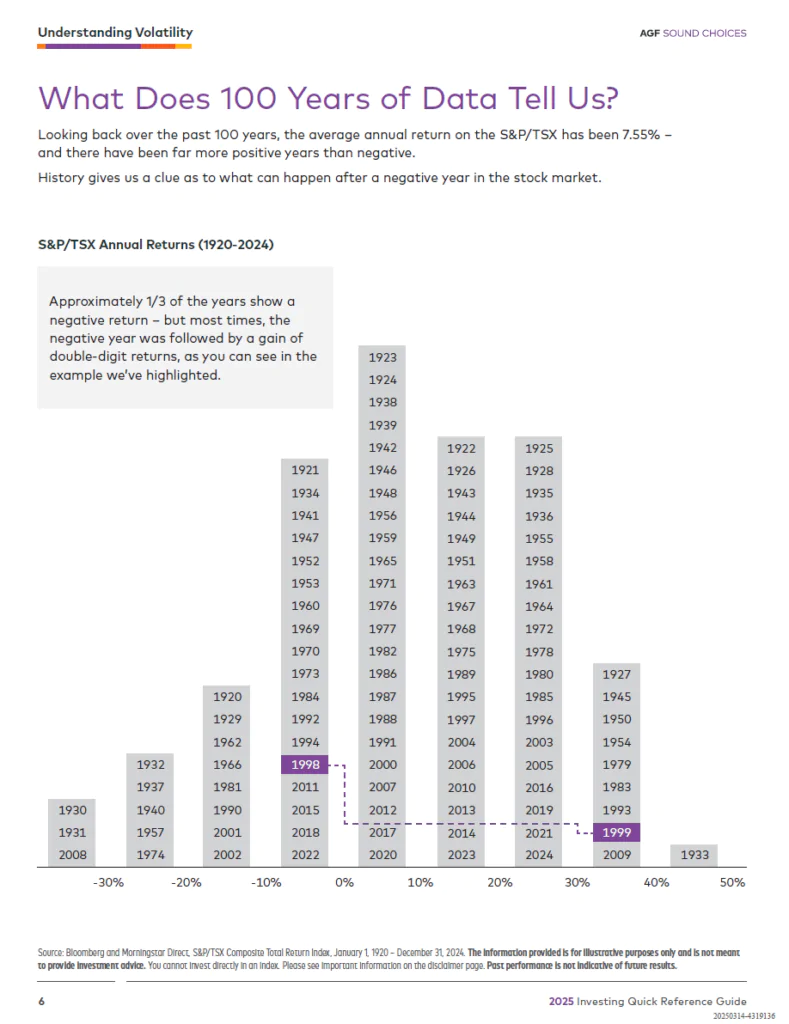
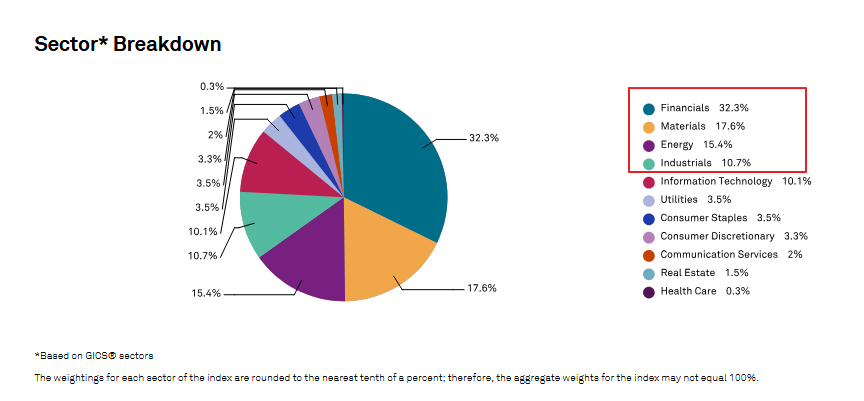
The composition of U.S. and Canadian equity markets vary widely. As a natural resources-based economy the Canadian market is concentrated by energy, mining and financial companies. The U.S. on the other hand has a very diversified economy with companies operating in pretty much every sector from manufacturing to defense technology. Hence the U.S. equity market is made up of companies from many sectors.
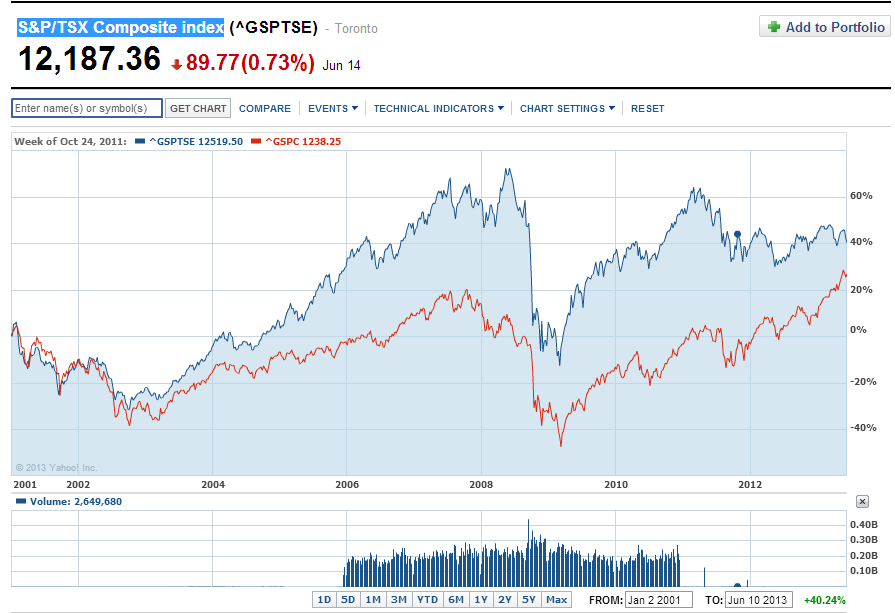
In terms of equity market returns, the benchmark TSX Composite index has outperformed the S&P 500 from 2001 thru 2012 as shown in the chart below:
Click to enlarge
However in the past 5-year the S&P 500 has up by over 25.0% while the TSX Composite is down by over 16.0% since the global demand for all types of commodities fell heavily:
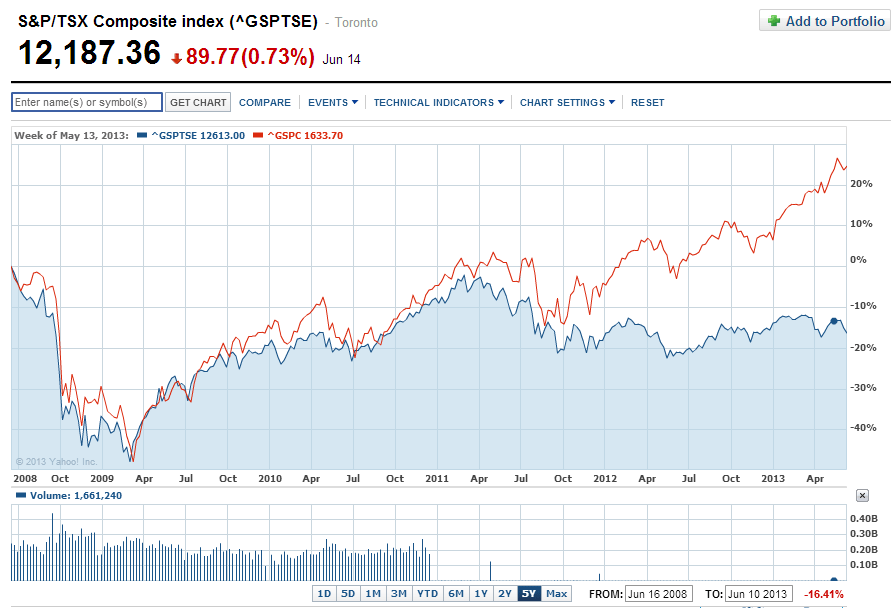
Source: Yahoo Finance
The following chart shows the performance of the two indices from 1970 thru 2015:
Click to enlarge
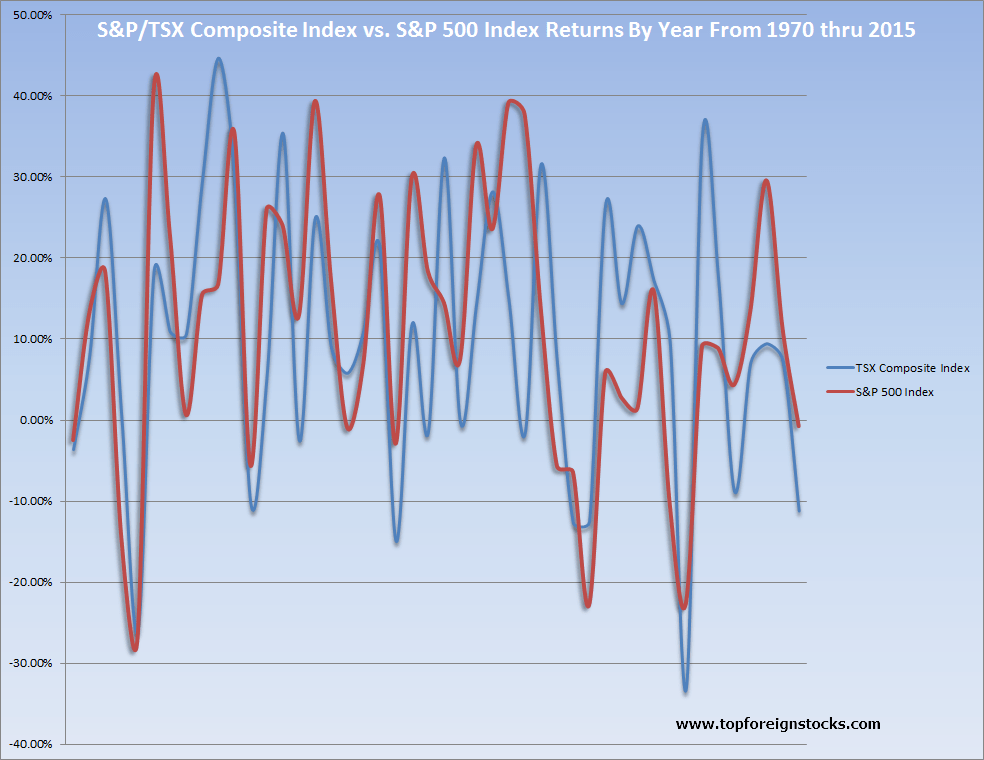
Though Canadian stocks seem to track U.S. stocks consistently they have diverged widely in some years.
The table below lists the data used in the chart above:
Table Updated – Oct 4, 2020
| Year | TSX Composite Index | S&P 500 Index |
|---|---|---|
| 1970 | -3.6% | -2.5% |
| 1971 | 8.0% | 13.2% |
| 1972 | 27.4% | 18.2% |
| 1973 | 0.3% | -14.7% |
| 1974 | -25.9% | -26.8% |
| 1975 | 18.5% | 40.7% |
| 1976 | 11.0% | 23.0% |
| 1977 | 10.7% | 0.7% |
| 1978 | 29.7% | 15.5% |
| 1979 | 44.8% | 16.8% |
| 1980 | 30.1% | 35.5% |
| 1981 | -10.2% | -5.6% |
| 1982 | 5.5% | 26.0% |
| 1983 | 35.5% | 24.0% |
| 1984 | -2.4% | 12.9% |
| 1985 | 25.1% | 39.4% |
| 1986 | 9.0% | 17.2% |
| 1987 | 5.9% | -0.9% |
| 1988 | 11.1% | 7.0% |
| 1989 | 21.4% | 27.8% |
| 1990 | -14.8% | -2.9% |
| 1991 | 12.0% | 29.9% |
| 1992 | -1.4% | 18.4% |
| 1993 | 32.5% | 14.5% |
| 1994 | -0.2% | 7.5% |
| 1995 | 14.5% | 33.9% |
| 1996 | 28.3% | 23.6% |
| 1997 | 15.0% | 39.2% |
| 1998 | -1.6% | 37.8% |
| 1999 | 31.7% | 13.9% |
| 2000 | 7.4% | -5.6% |
| 2001 | -12.6% | -6.4% |
| 2002 | -12.4% | -22.8% |
| 2003 | 26.7% | 5.8% |
| 2004 | 14.5% | 2.8% |
| 2005 | 24.1% | 1.5% |
| 2006 | 17.3% | 16.0% |
| 2007 | 9.8% | -10.3% |
| 2008 | -33.0% | -22.6% |
| 2009 | 35.1% | 9.1% |
| 2010 | 17.6% | 8.9% |
| 2011 | -8.7% | 4.4% |
| 2012 | 7.2% | 13.5% |
| 2013 | 9.55% | 29.6% |
| 2014 | 7.42% | 11.3% |
| 2015 | -11.09% | -0.7% |
| 2016 | 17.5% | 9.5% |
| 2017 | 6.03% | 19.4% |
| 2018 | -11.4% | -6.2% |
| 2019 | 19.1% | 28.8% |
| 2020 | ??? | ??? |
Note: The TSX returns noted are in Canadian dollar terms.
Related ETFs:
Disclosure: No Positions
Related: