The most valuable listed company in Europe is French luxury giant LVMH Moet Hennessy Louis Vuitton SA (LVMUY). At the end of 2022, its market capitalization stood at $342.0 billion Euros. In US dollar terms, it was $426.0 billion as of close of Jan 20, 2023.
Below is a short except from a recent journal article:
Some original founders have served investors well. Since LVMH went public in the 1980s, the stock has generated average total returns of 17% a year, and it is now Europe’s most valuable listed company. Richemont’s long-term record is also strong, with 14% returns. Prada is the exception: Its almost 12-year run as a public company has been poor, returning only 3% annually.
Source: Luxury Tycoons Leave Big Shoes to Fill, WSJ
Luxury stocks have indeed produced excellent returns over the long run.
Among the top listed European firms in terms of market capitalization, three luxury companies take a spot as shown in the chart below. The most valuable listed firms on Euronext Stock Exchange as of Dec, 2022 (in billion Euros):
Click to enlarge
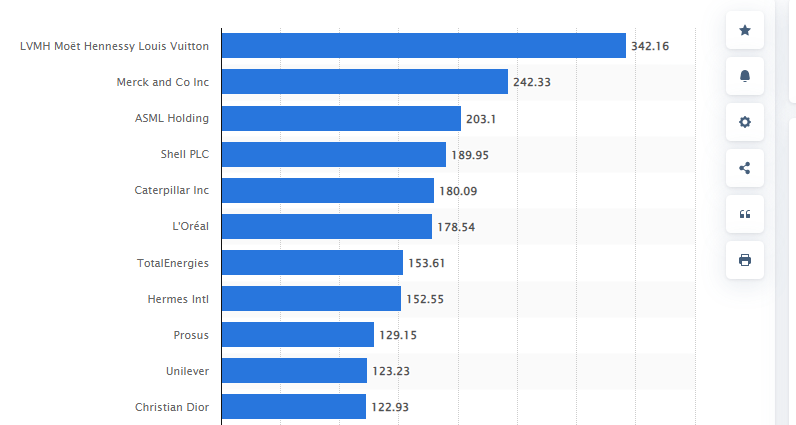
Source: Statista
Referenced firms:
Disclosure: No positions