Higher economic growth does not necessarily mean higher equity returns especially in the long terms. Many research studies have confirmed this theory. On a similar vein, higher wealth generation as measured by real per capita GDP growth does not necessarily mean higher real equity returns. The correlation between these variables over the very long-term is negative. So investors should not assume that simply because a country becoming richer will translate into higher equity returns.
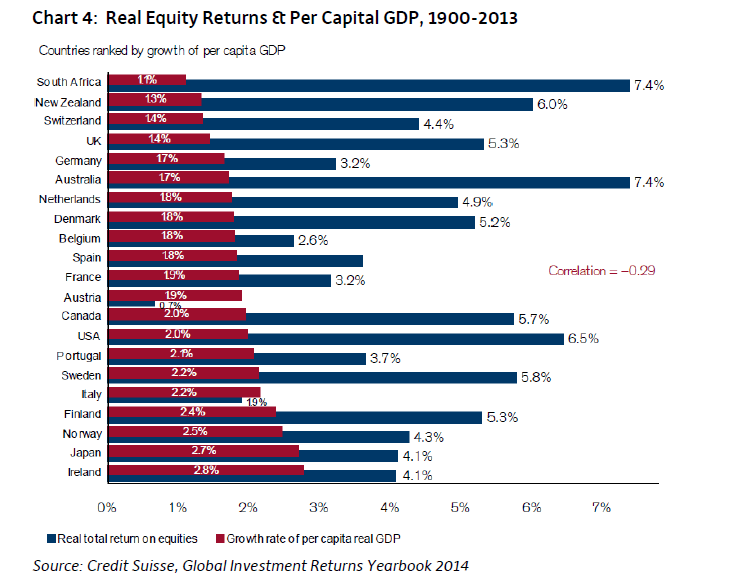
The chart below shows the negative correlation between real per capita GDP growth and equity returns for most of the developed world and one emerging country:
Click to enlarge
via The Absolute Return Letter, Absolute Return Partners, Mar 2014
A few observations from the above chart:
- The emerging country of South Africa had the lowest per capita GDP growth but yielded the highest equity returns during the period shown. As a commodity-based economy South Africa firms benefited from the growth of commodity demand over the past century generating higher equity returns.Another factor that can be considered is that most South African companies pay out about 50% of their earnings to shareholders in the form of dividends.
- The U.K. had higher equity returns than Germany despite a lower growth in per capita GDP.
- Similar to South Africa, Australia also had the highest equity returns at 7.4% despite a low per capita GDP growth of just 1.7%. The factors we discussed earlier for South Africa probably can be applied to Australia as well.
- Ireland had the highest per capita GDP growth but the equity returns were average.
- The U.S. had above above-average returns with a lower per capita GDP growth for the period shown.
It should be noted however that over very very long-term such as over a century equity returns are affected by many factors including rare events like World Wars. Since 1900, the world has seen World War I and II. During these events the economic impact on some countries were more severe than others. For example, during World War II the economies of Australia, Canada and the U.S. grew while much of the European economies particularly Germany’s was devastated as the allies crushed the Nazi regime. It took years and massive economic aid for Germany’s economy to recover. Today the German economy is the largest in Europe.
Related ETFs:
- iShares MSCI Germany Index Fund (EWG)
- iShares MSCI Canada Index Fund (EWC)
- iShares MSCI Australia Index Fund (EWA)
- SPDR S&P 500 ETF (SPY)
Disclosure: No Positions