Income investors looking for add dividend stocks to their portfolios can find plenty of attractive opportunities in Europe.Unlike U.S. companies European firms have traditionally paid out a large portion of their earnings to shareholders in dividends. While American stocks pay dividends quarterly most European stocks generally pay dividends only twice a year – an interim and a final dividend. It is incorrect to assume that simply because European companies pay dividends only twice a year they are worse than American companies. In fact, exactly the opposite is true. Not only most European firms have higher payout but also have higher dividend yields than their American peers. For example the current dividend yield on the S&P 500 is about 2.3%. It has stayed in the 2% for many years despite soaring corporate profits. Compared to the S&P’s low dividend yields, the latest dividend yields of select European markets are shown below:
- Austria: 2.8%
- France: 3.0%
- Germany: 2.5%
- Spain: 3.7%
- Sweden: 3.5%
- UK: 3.2%
Source: FT Market Data, The Financial Times
American companies used to have a strong dividend culture many decades ago when they rewarded shareholders with high and consistent dividends. Investors at that time invested in equities more for earning periodic income as opposed to price appreciation. However all that changed with the advent of stock options, investor’s attraction for stock price appreciation, Uncle Sam’s preferential tax policies for capital gains, glorification of CEOs who boost their company stock prices by any means necessary, explosive growth in trading volumes, the proliferation of hedge funds, corporate culture of short-term thinking, get-rich quick mentality of even retail investors, etc.
Note: In this post I have not addressed the issue of withholding taxes on European stock dividends for U.S. investors. However it is possible to earn superior returns with European equities even with the withholding taxes.
In contrast, European companies are not affected by most of the ills that plague U.S. companies and investors alike. As an example, some French companies pay long-term shareholders a “loyalty dividend” in addition to the regular dividends since they want to appreciate investors who hold on to their stock for a long time. American companies do not have such thinking. Even if they wanted to U.S. executives cannot implement “loyalty dividend” policies since many large institutional investors are themselves short-term traders and would not support such management proposal. Moreover the concept of “groupthink” also affects American companies heavily since any deviation from standards in the corporate world is considered too risky.
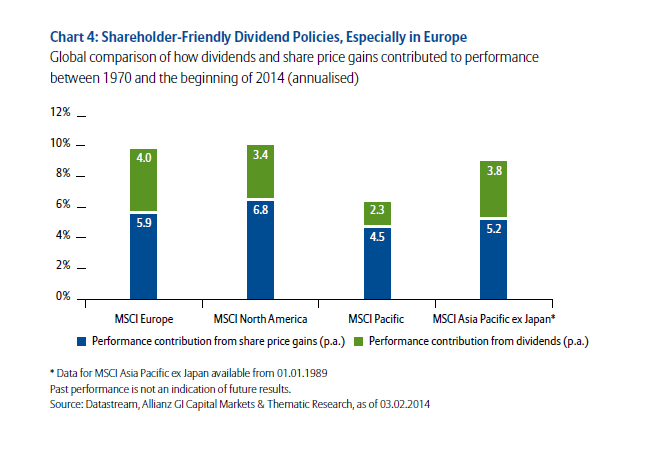
As we discussed above, the dividend policies of European firms are share-holder friendly. The following chart shows the contribution of dividends and stock price gains to total returns across regions:
Click to enlarge
The graph below shows the comparison of dividend payout ratios of European firms to their American peers:
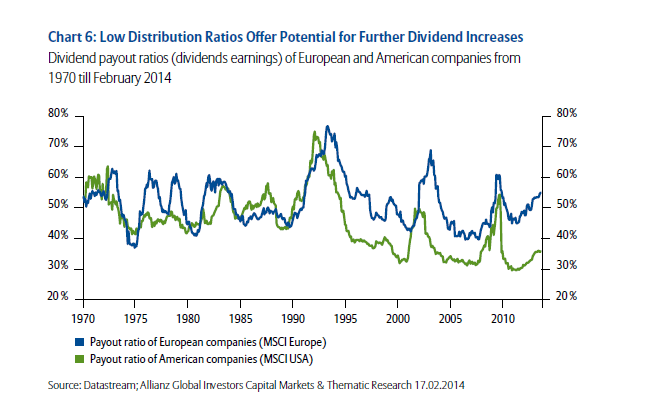
Source: Dividend strategies in times of financial repression, Alliance Global Investors
The EURO STOXX Select Dividend 30 Index is comprised of high dividend-yielding companies across 12 Eurozone countries. Ten constituents of this index are listed below with their ADR ticker and current dividend yields for further research:
1.Company: Allianz SE (AZSEY)
Current Dividend Yield: 4.36%
Sector:Insurance
2.Company: BASF SE (BASFY)
Current Dividend Yield: 2.44%
Sector: Chemicals
3.Company: AXA Group (AXAHY)
Current Dividend Yield: 4.22%
Sector: Insurance
4.Company: Banco Santander SA (SAN)
Current Dividend Yield: 8.39%
Sector: Banking
5.Company: Edp Energias De Portugal SA (EDPFY)
Current Dividend Yield: 3.37%
Sector: Electric Utilities
6.Company: Orange (ORAN)
Current Dividend Yield: 2.24%
Sector: Telecom
7.Company: Total SA (TOT)
Current Dividend Yield: 4.17%
Sector:Oil, Gas & Consumable Fuels
8. Company: Eni SpA (E)
Current Dividend : 4.62%
Sector:Oil, Gas & Consumable Fuels
9.Company: Unilever NV(UN)
Current Dividend Yield: 2.97%
Sector: Food Products
10.Company: Wolters Kluwer NV (WTKWY)
Current Dividend Yield: 3.20%
Sector: Media
Note: Dividend yields noted above are as of Apr 4, 2014. Data is known to be accurate from sources used.Please use your own due diligence before making any investment decisions.
Disclosure: Long SAN, AXAHY