Canadian Pacific Railway (CP), one of the two major railroads in Canada, has outperformed Canadian National (CNI) in the past few years. The former CEO of CN, Hunter Harrison became the CEO of CP in mid 2012.
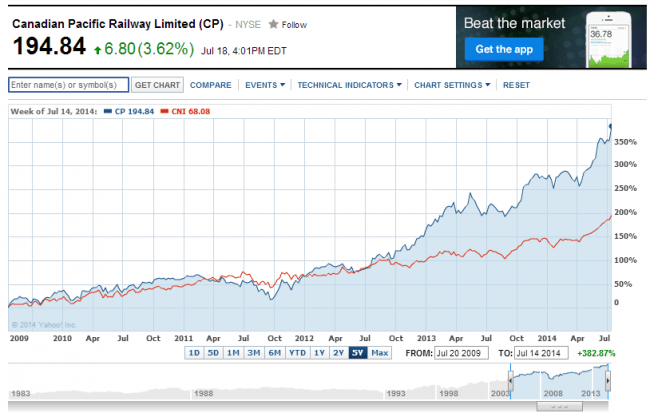
In the past two years CP has soared by over 161% in terms of price appreciation alone while CNI is up by over 56%. The five-year returns for the two railroads are shown in the chart below:
Click to enlarge
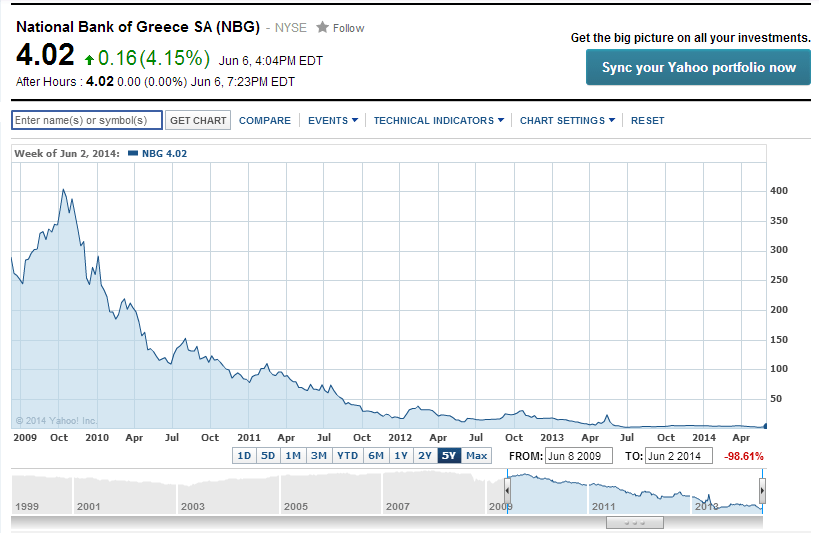
Source: Yahoo Finance
In the past 5 years, Canadian Pacific has shot up by over 382%. But Canadian National is up by just over 196%. As of Friday’s close CP has a market cap of over $34.0 billion while CN has a market cap of over $56.0 billion.
Disclosure: Long CNI

