Stock markets in developing countries are small in terms of market capitalization compared to their peers in the developed world. The latest issue of The Economist has the following graphic on emerging market equities:
Click to enlarge
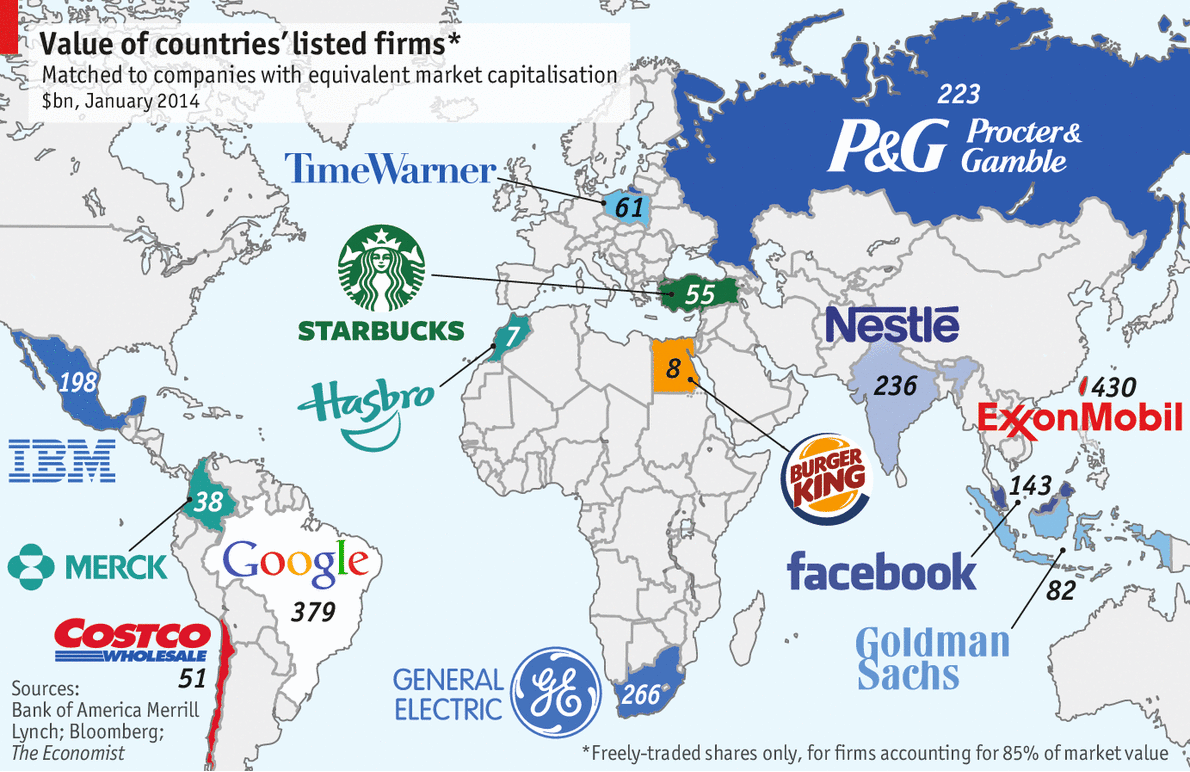
Source: Shares in emerging markets Scarce, The Economist
It should be noted that only the freely traded shares that feature in the local MSCI share index is used for calculating the market capitalization. This graphic does not represent the market capitalization of the all the companies listed in a particular country.According to the Economist note, all the shares available in India are worth roughly equal to Nestle. Similarly all the shares available in Egypt are equal to Burger King.Currently Nestle (NSRGY) and Burger King Worldwide (BKW) have a market capitalization of about $238.0 billion and $8.0 billion respectively.
For a better comparison of I reviewed market capitalization data from the World Federation of Exchanges. The table below shows the domestic total market caps of select emerging and frontier markets in US dollar terms at the end of 2013:
| Exchange | Domestic Market Capitalization (in USD Billions) | Percentage Change from Dec 2012 (in USD) | Percentage Change from Dec 2012 (in local currency) |
|---|---|---|---|
| Americas | |||
| Bermuda SE | - | - | |
| BM&FBOVESPA | 1,020.46 | -16.9% | -4.2% |
| Buenos Aires SE | 53.10 | 55.0% | 105.5% |
| Colombia SE | 202.69 | -22.7% | -15.4% |
| Lima SE | 80.98 | -21.1% | -13.5% |
| Mexican Exchange | 526.02 | 0.2% | 1.0% |
| NASDAQ OMX | 6,084.97 | 32.8% | 32.8% |
| NYSE Euronext (US) | 17,949.88 | 27.4% | 27.4% |
| Santiago SE | 265.15 | -15.4% | -7.1% |
| TMX Group | 2,113.82 | 2.7% | 9.6% |
| Total region | 28,297.07 | 22.0% | |
| Asia - Pacific | |||
| Australian SE | 1,365.96 | -1.5% | 14.3% |
| BSE India | 1,138.83 | -9.9% | 1.8% |
| Bursa Malaysia | 500.39 | 7.2% | 14.9% |
| Colombo SE | 18.81 | 10.8% | 13.5% |
| GreTai Securities Market | 78.00 | 30.3% | 33.8% |
| Hong Kong Exchanges | 3,100.78 | 9.5% | 9.5% |
| Indonesia SE | 346.67 | -19.0% | 2.2% |
| Japan Exchange Group - Osaka | - | - | |
| Japan Exchange Group - Tokyo | 4,543.17 | 30.6% | 58.7% |
| Korea Exchange | 1,234.55 | 4.7% | 3.2% |
| National Stock Exchange India | 1,112.95 | -9.8% | 1.8% |
| Philippine SE | 217.32 | -5.2% | 2.4% |
| Shanghai SE | 2,496.99 | -2.0% | -4.7% |
| Shenzhen SE | 1,452.15 | 26.3% | 22.7% |
| Singapore Exchange | 744.41 | -2.7% | 0.6% |
| Taiwan SE Corp. | 822.71 | 11.9% | 14.8% |
| The Stock Exchange of Thailand | 354.34 | -9.1% | -2.3% |
| Total region | 18,415.08 | 8.8% | |
| Europe - Africa - Middle East | |||
| Abu Dhabi SE | 109.64 | 61.4% | 61.3% |
| Amman SE | 25.76 | -4.5% | -4.7% |
| Athens Exchange | 70.19 | 56.4% | 49.6% |
| BME Spanish Exchanges | 1,116.56 | 12.2% | 7.4% |
| Borsa Istanbul | 195.75 | -37.9% | -25.2% |
| Budapest SE | 19.80 | -4.6% | -6.9% |
| Casablanca SE | 53.83 | 2.6% | -1.0% |
| Cyprus SE | 2.10 | 5.5% | 0.9% |
| Deutsche Börse | 1,936.11 | 30.3% | 24.6% |
| Egyptian Exchange | 61.63 | 4.1% | 13.7% |
| Irish SE | 170.12 | 56.1% | 49.3% |
| Johannesburg SE | 942.81 | 3.9% | 28.2% |
| Ljubljana SE | 7.13 | 10.1% | 5.3% |
| London SE Group | 4,428.98 | 30.4% | 24.8% |
| Luxembourg SE | 78.64 | 11.8% | 7.0% |
| Malta SE | - | - | |
| Mauritius SE | 8.94 | 24.5% | 22.5% |
| Moscow Exchange | 770.66 | -6.6% | 0.4% |
| Muscat Securities Market | 36.77 | 21.4% | 21.3% |
| NASDAQ OMX Nordic Exchange | 1,269.21 | 27.5% | 22.0% |
| NYSE Euronext (Europe) | 3,583.90 | 26.5% | 21.1% |
| Oslo Børs | 265.38 | 9.3% | 19.2% |
| Saudi Stock Exchange - Tadawul | 467.37 | 25.2% | 25.2% |
| SIX Swiss Exchange | 1,540.70 | 24.9% | 21.4% |
| Tel Aviv SE | 203.30 | 25.6% | 16.9% |
| Wiener Börse | 117.67 | 11.0% | 6.2% |
| Total region | 17,482.95 | 21.6% | |
| WFE Total | 64,195.10 | 17.8% |
Notes:
- Johannesburg SE: figures include the market capitalization of all listed companies, but exclude listed warrants, convertibles and investment funds
- BME: Including investment companies listed (open-end investmetnt companies) that differ from investment funds included in table 1.3.2 because of their legal status and that cannot be distinguished from other listed companies.
- Australian SE: including investment funds
- JPX – Osaka SE: On 16 July 2013, Osaka SE cash equity products were listed on Tokyo SE
- JPX – Tokyo SE: On 16 July 2013, Osaka SE cash equity products were listed on Tokyo SE
- Korea Exchange: includes Kosdaq market data
- Mauritius SE: From Aug. 2006, data includes Development & Enterprise Market
- NASDAQ OMX Nordic Exchange : OMX includes Copenhagen, Helsinki, Iceland, Stockholm, Tallinn, Riga and Vilnius Stock Exchanges
- Singapore Exchange: market capitalization includes domestic listings and a substantial number of foreign listings, defined as companies whose principal place of business is outside of Singapore. Inactive secondary foreign listings are excluded.
- TSX Group: also includes TSX Venture market cap
- Total excludes Osaka and National Stock Exchange of India to avoid double counting with Tokyo and Bombay SE respectively
Source : World Federation of Exchanges members
Data Source: World Federation of Exchanges
The NYSE had a market cap of about $18.0 Trillion. Together with the NASDAQ the total US market cap was about $24.0 Trillion. This figure includes all the stocks (including those of foreign companies) listed on these markets.
In comparison, the Mexico had a market cap of $526 billion.Brazil was almost double that of Mexico’s with a total of just over $1.0 Trillion. India’s market cap came in at about $1.1 Trillion. China’s Shanghai Stock Exchange had a total market cap of about $2.5 Trillion and Russia’s figure stood at about $770 billion. China had the top market cap among the BRICs.
Canada’s TSX had a higher market cap than Australia’s $1.3 Trillion.
Disclosure: No Positions


