Comparing U.S. Oil Production To Select Countries

The production of Crude Oil in the U.S. continues to rise. The explosive growth in the exploration of oil by fracking and other factors have contributed to a resurgence of the country as a major oil producer.

U.S. crude oil production continuously rose from 1920 and reached its peak in 1970. After a stead decline from that time, production has regained momentum and has followed an upward trend since mid-2008 as shown in the chart below:

Click to enlarge

US Oil Production Chart

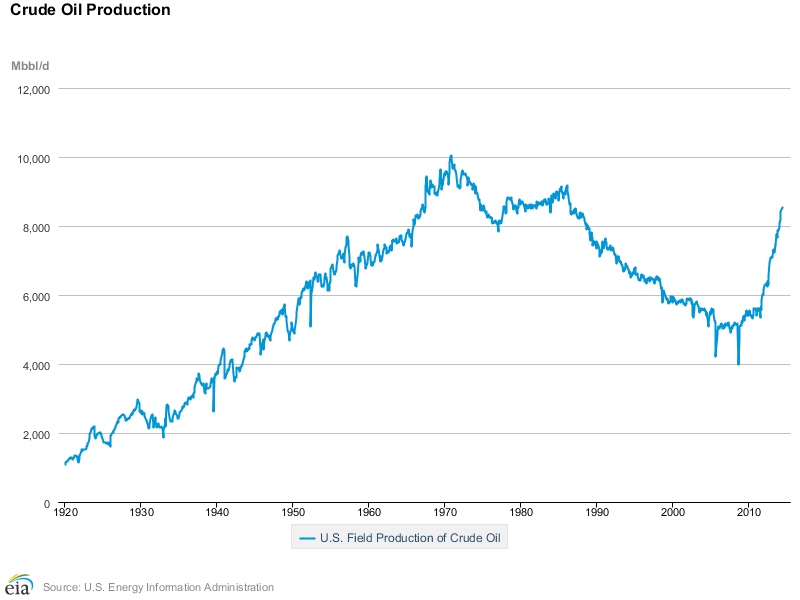
Source: U.S. Energy Information Administration

Note: The figures shown above are daily production figures.

In July of this year crude oil production totaled 8,537 Thousand Barrels per Day.

How does the US oil production compare to certain oil producing countries?

The map below shows the answer to the above question.

Click to enlarge

US Oil Map

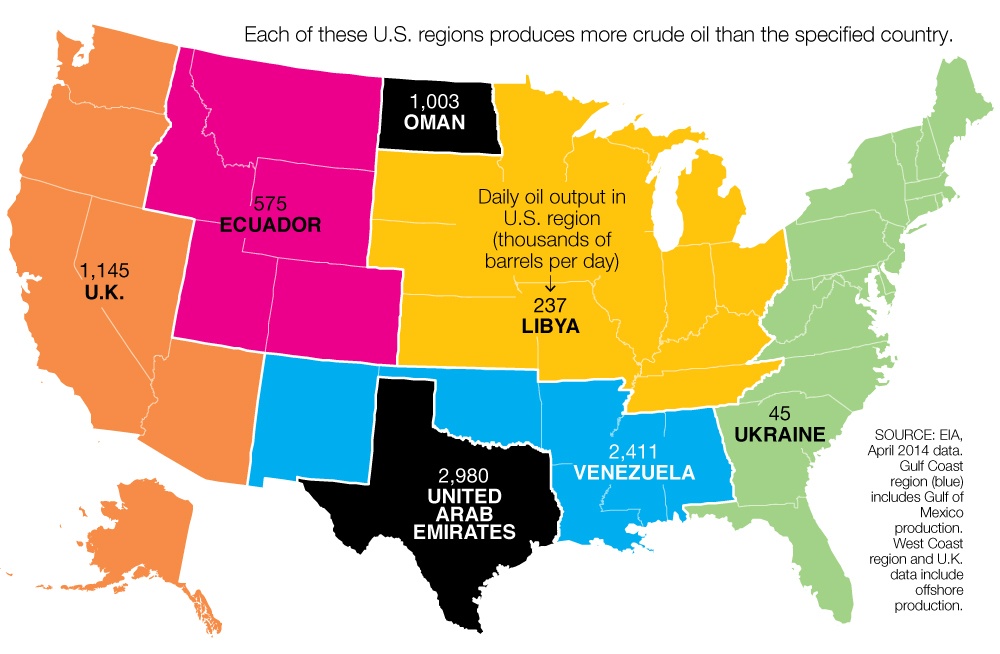
Via Malaysia-Finance

It is interesting that Texas produces more oil than UAE.

Related ETN:

  • iPath S&P GSCI Crude Oil TR ETN (USO)

Disclosure: No Positions

Two Reasons To Invest In Global Dividend-Paying Stocks

Investors looking for dividend income can consider adding foreign dividend stocks. I have written many articles before on why US investors must go overseas hunting for higher dividends. This article is another installment on the same topic.

In addition to getting the benefits of portfolio diversification, adding global dividend payers also makes sense for a variety of reasons. Two of the reasons are discussed below.

1. Nearly two-thirds of the world’s total dividends are paid by companies outside the U.S.  The chart below from a long-term Henderson Global Investors shows the split of  total dividends paid in 2013:

Click to enlarge

2013 Total Global Dividends Paid by Region

Source: Henderson Global Dividend Index, Edition Two, May 2014, Henderson Global Investors

2. Dividends paid outside the U.S. are much higher. The following chart shows that the dividend payout ratio in the U.S. is lower than in Australia, Continental Europe and the UK.

Dividend Payout Ratio by Region

Source: Going global pays dividends, September 2014, Henderson Global Investors

Five top global dividend payers are listed below with their current dividend yields for further research:

1.Company: British American Tobacco PLC (BTI)
Current Dividend Yield: 4.38%
Sector:Tobacco
Country: UK

2.Company: Vodafone Group PLC (VOD)
Current Dividend Yield: 4.06%
Sector: Wireless Telecom
Country: UK

3.Company: AstraZeneca PLC (AZN)
Current Dividend Yield: 4.09%
Sector: Pharmaceuticals
Country: UK

4.Company: Sanofi (SNY)
Current Dividend Yield: 3.06%
Sector: Pharmaceuticals
Country: France

5.Company:Commonwealth Bank of Australia (CMWAY)
Current Dividend Yield: 5.56%
Sector: Banking
Country: Australia

Note: Dividend yields noted above are as of Oct 13, 2014. Data is known to be accurate from sources used.Please use your own due diligence before making any investment decisions.

Disclosure: No Positions

Ten Foreign Dividend Stocks To Buy Now

The S&P 500 is up by 3.1% year-to-date as of Oct 10th on price basis. Many other developed markets have fared even worse so far this year. The year-to-date return of some of the major markets are listed below:

UK’s FTSE100: – 6.1%
France’s CAC 40: -5.2%
Germany’s DAX Index: -8.0%
Australia’s S&P/ASX 200: -3.1%
Japan’s Nikkei: -6.1 %
Singapore’s Straits Times Index: 1.8%

The decline in these and other foreign markets present plenty of opportunities for investors hunting for dividend stocks.

I wrote about the decline in the dividend payout ratios of US stocks in an article last month. I have the attached the US historical dividend payout ratio chart from that article below for putting the payout ratio and the dividend yield in perspective.

Click to enlarge

US Dividend Payout Ratio chart

Source: Going Global Can Pay Dividends, PIMCO, December 2013

I came across an interesting piece in the Journal on US dividends. From the article by Morgan House:

Dividends paid by companies in the S&P 500 currently amount to less than 2% of their share prices, compared with the long-term average of 4.4%, according to data from Yale University economist Robert Shiller.

Dividends also are falling steadily as a share of earnings, with about a third of profits getting returned to shareholders in recent years, compared with nearly half in the 1980s and 1990s.

If S&P 500 companies paid out the same percentage of profits as dividends during the decade ended Dec. 31, 2013, as they did from 1950 to 2000, shareholders would have received nearly $1 trillion more in dividends than they actually did.

Historical S&P 500 Dividend Yield

Source: Not Your Father’s Dividend Stocks, The Wall Street Journal, Oct 3, 2014

Mr.Housel also included the following on foreign stocks:

For investors looking for more income, a high dividend yield still can be found. You just might have to look abroad.

As the U.S. market has gotten more expensive, many of the best opportunities for yield are in international stocks, which tend to trade at lower valuations and have higher payout ratios, says Patrick O’Shaughnessy, portfolio manager at O’Shaughnessy Asset Management in Stamford, Conn., which manages $7.5 billion. “Yield is safer when valuations are lower than the market, providing a margin of safety,” he says.

Ten foreign stocks with high dividend yields are listed below for consideration with the first three suggested by Mr.Patrick:

1.Company: Total SA (TOT)
Current Dividend Yield: 4.80%
Sector:Oil, Gas & Consumable Fuels
Country: France

2.Company: Telstra Corp Ltd (TLSYY)
Current Dividend Yield: 5.77%
Sector:Telecom
Country:  Australia

3.Company: BCE Inc (BCE)
Current Dividend Yield: 5.19%
Sector: Telecom
Country:  Canada

4.Company: Swedbank AB (SWDBY)
Current Dividend Yield: 6.53%
Sector: Banking
Country: Sweden

5.Company:Telenor ASA (TELNY)
Current Dividend Yield: 5.72%
Sector: Telecom
Country: Norway

6.Company: DBS Group Holdings Ltd(DBSDY)
Sector: Banking
Current Dividend Yield: 4.78%
Country: Singapore

7.Company: Vodafone Group PLC (VOD)
Current Dividend Yield: 4.06%
Sector: Wireless Telecom
Country: UK

8.Company: Bank of Nova Scotia (BNS)
Current Dividend Yield: 3.77%
Sector: Banking
Country:  Canada

Stocks of Canadian companies held in retirement accounts by US investors are exempt from Canadian dividend withholding tax.

9.Company:Edp Energias De Portugal SA (EDPFY)
Current Dividend Yield: 6.13%
Sector: Electric Utilities
Country: Portugal

10.Company: Legal & General Group plc (LGGNY)
Current Dividend Yield: 4.47%
Sector: Insurance
Country: UK

Note: Dividend yields noted are as of Oct 10, 2014. Data is known to be accurate from sources used.Please use your own due diligence before making any investment decisions.

Disclosure: Long BNS, SWDBY

On The Historical Dividend Payout Ratio Of European Stocks

In an article last month I discussed about the continued decline in the dividend payout ratio of U.S. stocks. The following chart shows the historical dividend payout ratio of European stocks based on the MSCI Europe Index. This ratio mostly stays about 40% in Europe and is on an upward trend since mid-2011.

Click to enlarge

Historical Dividend Payout Ratio

Source: FactSet Dividend Quarterly Europe: December 17, 2013, Factset

Ten of the top European dividend payers based on aggregate dividend amounts paid out to investors last year are listed below with their current dividend yields:

1.Company: Vodafone Group PLC (VOD)
Current Dividend Yield: 4.06%
Sector: Wireless Telecom
Country: UK

2.Company: Royal Dutch Shell PLC (RDS.B)
Current Dividend Yield: 5.16%
Sector: Oil, Gas & Consumable Fuels
Country: UK

3.Company: Total SA (TOT)
Current Dividend Yield: 4.80%
Sector:Oil, Gas & Consumable Fuels
Country: France

4.Company: Nestle SA (NSRGY)
Current Dividend Yield: 3.38%
Sector: Food Products
Country: Switzerland

5.Company: Roche Holding AG (RHHBY)
Current Dividend Yield: 3.23%
Sector: Pharmaceuticals
Country: Switzerland

6.Company: HSBC Holdings PLC (HSBC)
Current Dividend Yield: 4.92%
Sector: Banking
Country: UK

7.Company: BHP Billiton Ltd (BHP)
Current Dividend Yield:  4.34%
Sector:Metals & Mining
Country: UK

8.Company: GlaxoSmithKline (GSK)
Sector:Oil, Gas & Consumable Fuels
Current Dividend Yield: 6.02%
Country: UK

9.Company: Novartis AG (NVS)
Current Dividend Yield: 2.05%
Sector: Pharmaceuticals
Country: Switzerland

10.Company: BP PLC (BP)
Sector:Oil, Gas & Consumable Fuels
Current Dividend Yield: 5.56%
Country: UK

Switzerland has the highest dividend withholding taxes for US investors with a rate of 35%. Hence investors need to take this into consideration when investing in Novartis or other Swiss firms. On the other hand, dividends paid by British companies to US investors are not taxed by the UK . Hence British ADRs are attractive from a tax standpoint. However dividends paid to American investors by UK REITs will be taxed at 20%. This rate applies to both retirement and non-retirement accounts.

Note: Dividend yields noted above are as of Oct 10, 2014. Data is known to be accurate from sources used.Please use your own due diligence before making any investment decisions.

Disclosure: No Positions

S&P 500 Annual Total Return By Year From 1927 To 2013

The S&P 500 is up 3.13% and 4.78% year-to-date in terms of price and total returns respectively. Total return is higher since it includes dividends. The index has given up much of the gains recently from the peak reached earlier this year as markets around the world have become extremely volatile due to a variety of issues including worries about global growth, interest rate increase by the Federal Reserve, Ebola virus, Ukraine crisis, ISIS, Syria, oil prices, global warming, German exports,  China slowdown, collapse of commodity prices, lack of public sighting of North Korean leader Kim Jong Un, Catalonia’s independence from Spain, Hong Kong protests, Russian economy and so forth.

In 2013, the S&P soared by a staggering 30%. When dividends are included the return was even higher at 32.39%. After that strong run up last year and the return of volatility with a vengeance, many investors may be wondering if the rest of the year will bring further correction in stock prices. Such worries may be misplaced. According to a research report by LPL Financial, strong returns in equities are historically followed by more strong years. Hence though stocks are going through violent swings now it might as well turn out to be another strong year for the US market.

Click to enlarge

SP 500 Total Returns By Year

Source:  Outlook 2014, LPL Financial

From the research report:

Some may fear an outsized gain in the stock market during 2013, is surely to be punished with losses in the coming year. However, historically after a one-year total return in the 25 – 30% range, the S&P 500 has followed it up by more solid years of gains. In fact, the average return in a year following a 25 – 30% gain was 12%, and stocks posted a double-digit gain in four of the five occurrences (the exception was 1961’s gain of 26.9%, which was followed by a loss of 8.7% in 1962) [Figure 4]. In fact, most of the years were actually followed by several years of strong gains, as was the case in 1943,2003, and 2009.

Related ETF:

  • SPDR S&P 500 ETF (SPY)

Disclosure: No Positions