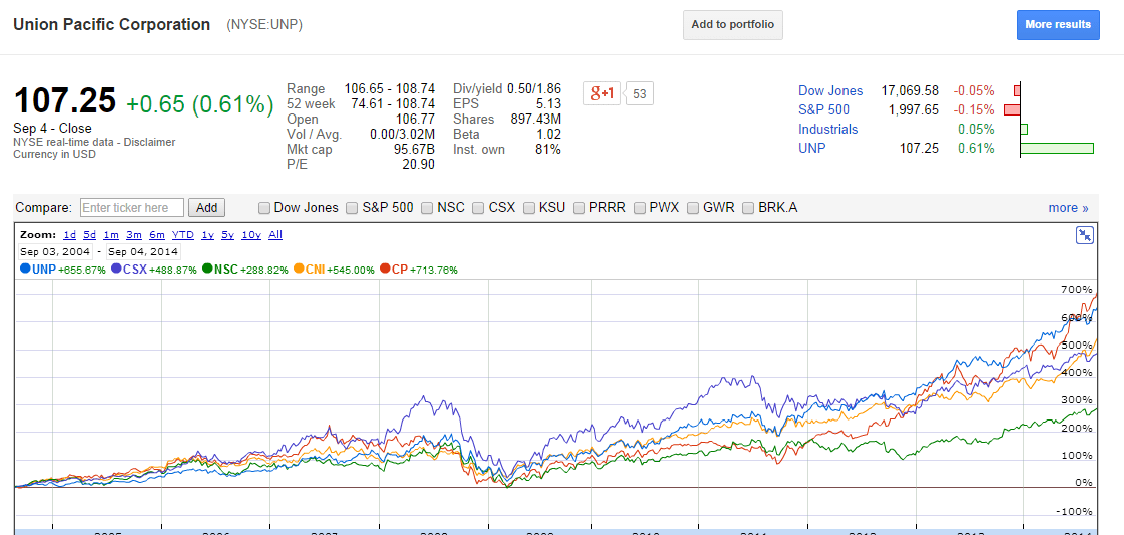
Canadian Railroads Beat Major U.S. Railroads Over 10, 5 Year Periods and Year-to-date

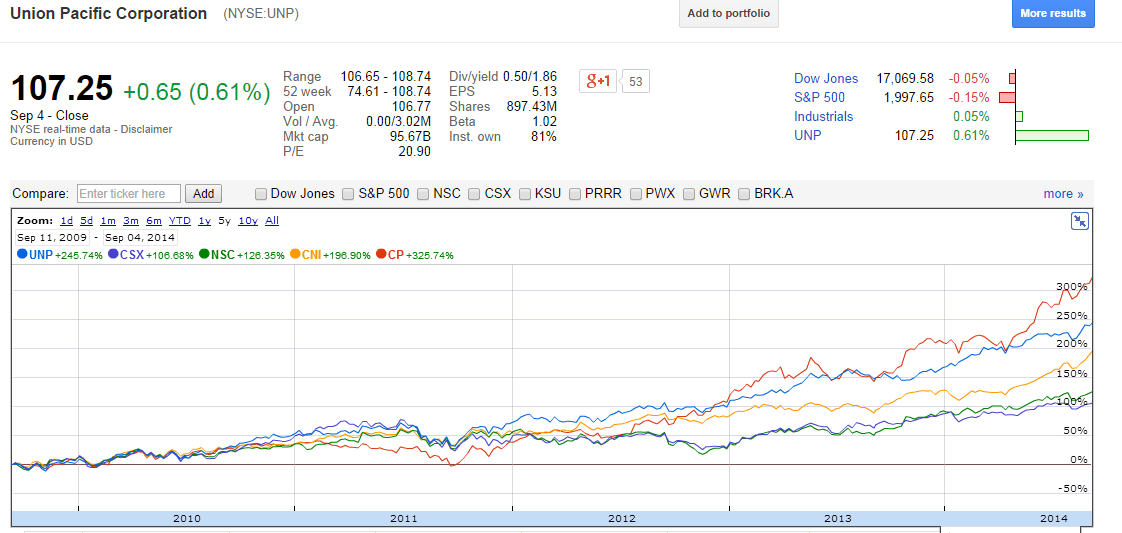
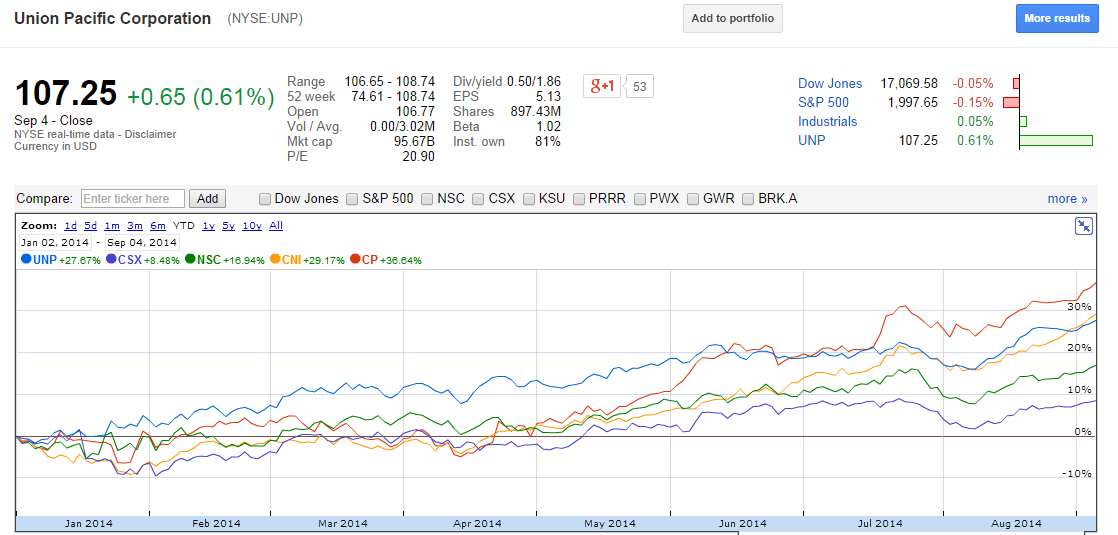
Canadian railroad stocks have performed better than major American railroads over various periods as shown in the charts below. Canadian Pacific (CP) as noted in red color is the best performer of the railroads shown in the charts.

a) Stock performance over 10 years:

Click to enlarge

Major Railroad Stocks 10 Years

b) Performance over 5 years:

Major Railroad Stocks 5 Years

c) Performance year-to-date:

Major Railroad Stocks YTD


Source: Google Finance

Disclosure: Long CNI, CSX, NSC
 

Download: Barclays Equity Gilt Study 2013

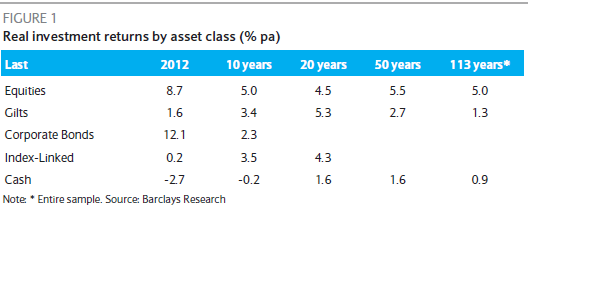
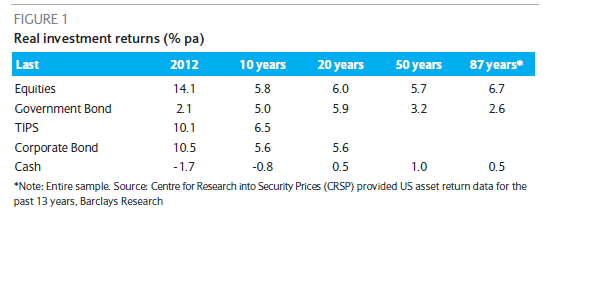
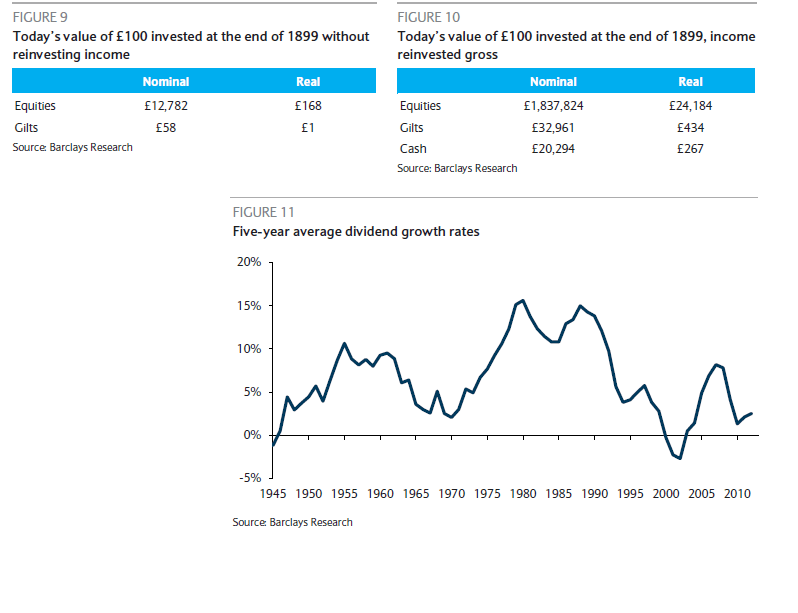
Every year Barclays publishes the popular Equity Gilt Study which contains a multitude of fascinating charts and data. The following are some of the charts from the report for 2013.

a) UK Asset Returns since 1899

Click to enlarge

UK Asset Returns since 1899

b) US Asset Returns over many periods

US Asset Returns Over Various Periods

c) The importance of reinvestment

Importance of Reinvestment

You can download the full report in pdf by click on the image below:

Barclays Equity Guild Study Report 2013

or click to download here.

For the previous year report go here.

Download: Credit Suisse Global Investment Returns Yearbook 2014

Every year Credit Suisse publishes their famous Global Investment Returns Yearbook. This year’s version was released back in February. This year’s report includes many fascinating charts and facts. The entire report is worth a review.

Below are some sample charts from the Credit Suisse Global Investment Returns Yearbook 2014:

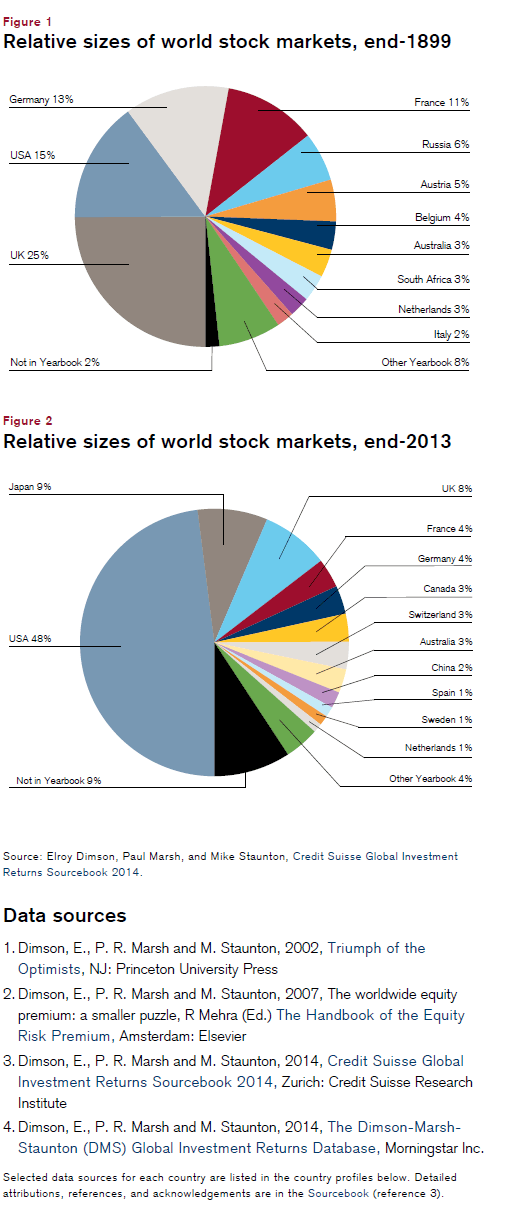
1) Relative size of World Stock Markets at the end of 1899 and 2013

Click to enlarge

World Stock Market Sizes in 1899 and 2013

At the beginning of the 20th century the UK’s equity market size was one-fourth of the total global equity market. With the loss of most of it colonies in the early 1900s British power and influence declined. Accordingly the dominance of British companies also declined.

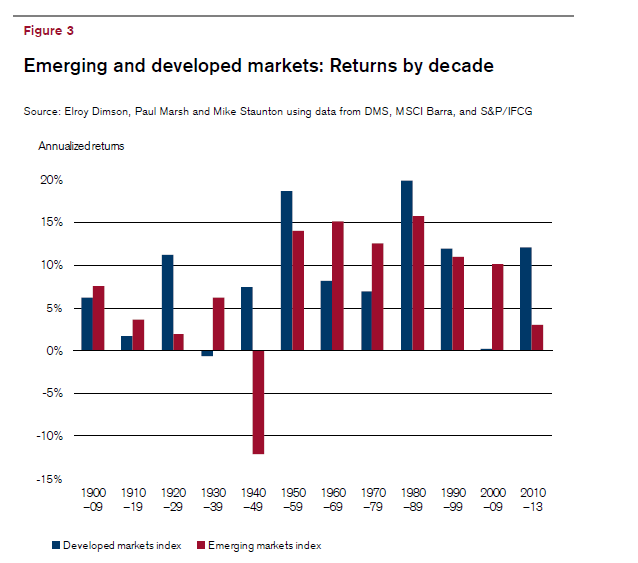
2) Emerging and Developed Markets’ Equity Returns by Decade

Emerging and Developed Markets Returns By Decade

You can download the full report by clicking on the image below or here.


Credit-Suisse-Global-Investment-Returns-Yearbook-2014Source: Credit Suisse Research Institute

You can find the 2013 Yearbook  here.


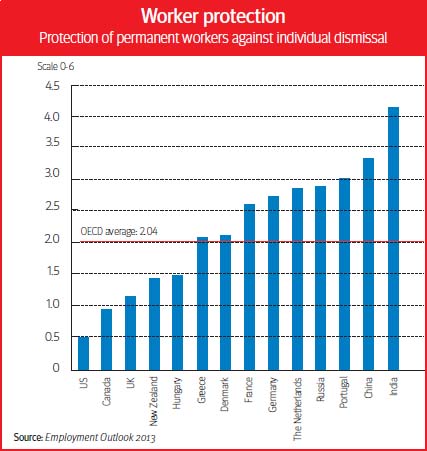
Protection of Permanent Workers Against Individual Firing in Select Countries

In the developed world protection of permanent workers against individual dismissal is generally very high in Europe. However some emerging countries have better protection for workers than in Europe as shown in the chart below:

Click to enlarge

Worker Protection by Country

Source: Containting costly job losses, OECD Observer

According to OECD, India has the highest protect for permanent workers while the U.S. has the lowest. In fact, India labor laws for permanent workers is stricter than China’s.

From an article in Knowledge@Wharton from Wharton School of the University of Pennsylvania:

India’s labor laws — largely unchanged from how the British wrote them — have a negative view of private sector employers. This view believes that all employers are exploiters; that most employees have no alternative employment options; that most employers are big companies, and that shareholders pay salaries not customers. This has led to four painful defects in India’s labor market: 12% manufacturing employment (the same as the post-industrial U.S.), 50% agricultural employment (240 million Indian produce less food than four million Americans), 50% self-employment (the poor cannot afford to be unemployed, so they are subsistence self-employed), and 90% informal employment (100% of net job creation since 1991 has happened informally.)

India’s labor laws are a mess. It is practically impossible to comply with 100% of them without violating 10% of them. Most employment contracts are marriages without divorce; on paper you can’t get rid of an employee once you have hired him or her. (emphasis added)

Source: Why the New Labor Law Reforms Make India Fertile for Jobs, Knowledge@Wharton

I is interesting that Russia ranks higher than even France in worker protection. However it must be noted that Russia until a few decades ago was a communist country and laws were created that favored workers. Even today the majority of the workforce in Russia work in the public sector and the state is the largest employer.

It should be noted that since hiring and firing of both temporary and permanent workers is easy in the U.S., the American economy is the most vibrant economy in the world. American employers hire workers when demand picks up for their products or services and fire or lay them off during periods of slack demand. This is not possible in most of the countries shown in the above chart. Hence workers stay on a company’s payroll sometimes for years as it is difficult for employers to get rid of them.

Related: Factbox: India’s stringent labor laws, Reuters

Five Large-Cap Foreign Companies To Consider Instead of Their U.S. Peers

The dividend yield of the S&P 500 has stayed at around 2% for many years.Investors looking for higher yields can consider foreign equities many of which have much higher dividend yields.Traditionally European companies tend to have higher dividend yields than U.S. firms.

Despite withholding taxes on dividends imposed on U.S. investors by most foreign governments and other factors, its still possible to earn higher dividend income by investing in foreign companies than their U.S. counterparts. In this post lets a take a look at how the dividend yield of five large-cap foreign companies compares with their U.S. peers.

1. The current dividend yield of  French oil major Total SA (TOT) is 5.22%. Some of its U.S. peers such as Exxon Mobil Corp (XOM) and Chevron Corp (CVX) have yields of only 2.77% and 3.31% respectively.

2.The American tobacco giants Lorillard Inc(LO) has a dividend yield of 4.12%.The equivalent British company Imperial Tobacco Group PLC (ITYBY) has a yield of 4.56%.

3.British mobile telecom giant Vodafone Group PLC (VOD) has a dividend yield of 6.83% compared to AT&T Inc(T)’s 5.26% and Verizon Communications Inc’s(VZ) 4.26%.

4.American food companies Kellogg Co(K) and General Mills Inc(GIS) have dividend yields of 3.02% and 3.07% respectively.Their Swiss peer Nestle SA pays a dividend of 3.12%.

5.US chemical makers E I du Pont de Nemours and Co(DD) and Dow Chemical Co(DOW) 2.84% and 2.76% respectively.However their German peer BASF SE(BASFY) has a dividend yield of 3.64%.BASF is the world’s largest chemical company.

Please note that I have selectively picked the above examples. We can find foreign companies that have dividend yields that are the same or even lower than that of U.S. firms. The point here is to emphasize the importance of looking abroad for dividend income.Withholding taxes on foreign dividends may wipe out any gains due to the higher dividend yields of foreign companies. However some countries such as Canada waive the tax if the security is held in qualified retirement accounts such as 401(k), Traditional and Roth IRAs, etc.

Note: Dividend yields noted above are as of Aug 29, 2014. Data is known to be accurate from sources used.Please use your own due diligence before making any investment decisions.

Disclosure:  Long GIS