The total assets of the U.S. Federal Reserve stood at over $4.0 Trillion at in December 2013. To be more exact, it reached a record high of $4,008,062,000,000.
Click to enlarge
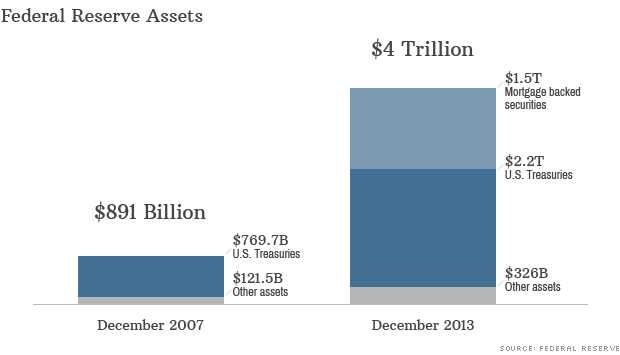
Source: Fed’s assets top $4 trillion, CNN, Dec 19, 2013
It is not just the balance sheets of the Fed and the European Central Bank are expanding, the People’s Bank of China has a bigger balance sheet than the Fed according to an article by Dennis Lim of Franklin Templeton Investments.
Click to enlarge
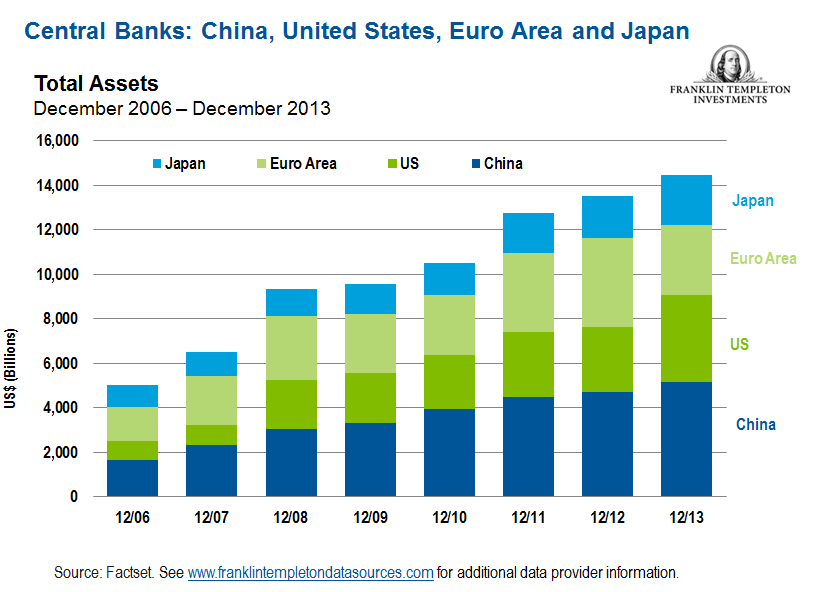
Source: ASEAN’s Ambitious Agenda by Dennis Lim of Franklin Templeton Investments, Dec 10, 2014
From the article:
If you combine the balance sheets of the Fed, the ECB, the PBOC and the Bank of Japan (BOJ), their combined assets at the end of 2013 stood at over US$14 trillion, which is almost the size of the US economy.
For comparison purposes, the size of the US economy was estimated to be about $17.0 Trillion based on purchasing power parity according to CIA’s World Factbook.