The U.S. equity market has had an excellent performance two years in a row. In 2013, the S&P 500 soared by 29.6% on price basis and this year it is up by 12.6% as year-to-date (YTD) as of Dec 22nd. Many developed and emerging markets on the other hand have had a bad year with returns that pale in comparison to that of the S&P 500.
The YTD price returns of some of the major developed markets are listed below:
UK’s FTSE 100: -2.2%
France’s CAC 40: 0.4%
Germany’s DAX: 3.9%
Spain’s IBEX 35: 5.7%
Canada’s S&P/TSX Composite: 7.1%
Japan’s Nikkei: 8.2%
Australia’s S&P/ASX 200: 0.5%
Last year many of the foreign equity markets lagged the performance of the U.S. market.
Since U.S. stocks are generating great returns some investors may be tempted to dump their foreign stock holdings now. But doing so is not a wise strategy according to two industry experts.
From an article titled Do Foreign Stocks Still Make Sense? by Gregg S. Fisher in Forbes magazine:
The Rearview Mirror
An investor who sells foreign stocks now and adds the money to US stocks is guilty of what in behavioral finance we call the availability bias—the belief that easily recalled recent outcomes (e.g., US market outperformance) will persist in the future. In other words, regardless of valuations and implied expected returns, an emotional investor buys recent winners and sells the losers.
If you watch stock market shows on TV, you probably hear investment pundits convey the impression that they can identify winning markets and asset classes in advance. I encourage you take such forecasts with a grain of salt. There will always be one market or asset that beats the others, but these will trade places nearly every year or even six-month period and are unknowable in advance.
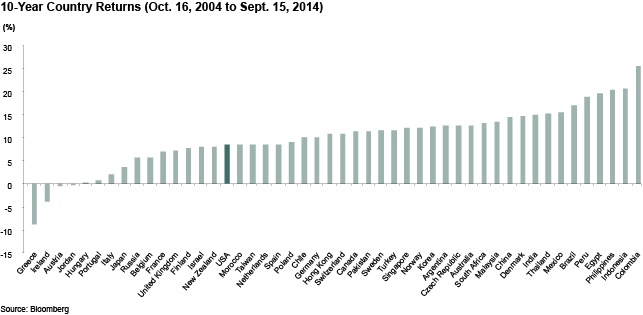
Since the US market shines today, it may surprise you that when we studied 48 developed- and developing-country markets around the world, not once over trailing 1, 3, 5 and 10-year periods (to September 15, 2014) did the US market rank even in the top five. As the exhibit below shows, over 10 years, 32 countries performed better than the US market.
Click to enlarge
Source: Do Foreign Stocks Still Make Sense?, Gregg S. Fisher, Nov 4, 2014, Forbes
The above chart shows that the U.S. was nowhere near the top five or even ten performing markets. Among the developed markets, countries such as Denmark, Norway, Sweden, Switzerland, etc. performed much better than the U.S.. Mr.Fisher also noted the following:
Since we cannot predict the future, I firmly believe in global diversification, a strategy that has in fact made sense in virtually every long-term period we’ve studied. We like to use rolling returns, which are overlapping cycles starting on the first day of the month and provide a more accurate picture of performance than a snapshot during a single time period. When we look back at all 94 ten-year rolling periods from January 1, 1997 to September 30, 2014, a globally diversified portfolio (64% S&P, 23% MSCI EAFE, 13% MSCI Emerging Markets) outperformed a US-only one in 100% of time periods and by an average margin of 1.77 percentage points annualized. Those are the kind of odds that I like.
The second article that discussed the same topic is by Seth J. Masters,Chief Investment Officer of Bernstein Global Wealth Management.. From Lessons Learned in 2014 published on Dec 10, 2014:
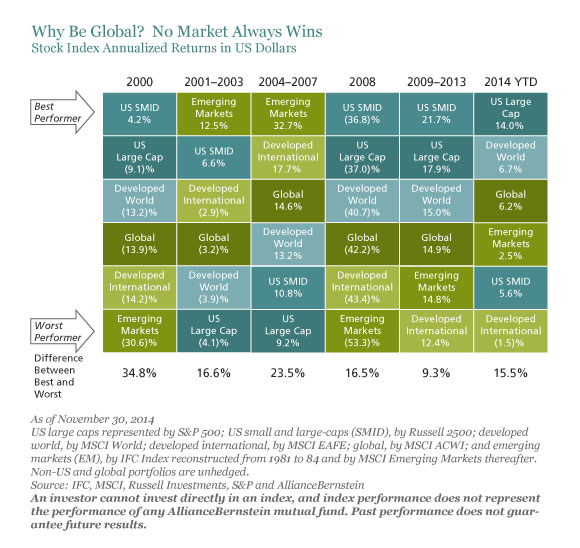
Lesson 2: Diversification Means Owning Laggards
After leading globally in 2013, in 2014 through November the US stock market beat developed international stock markets by 15.5 percentage points in US dollar terms; it beat emerging markets by 11.5 percentage points, as shown in the first Display, below. This outperformance by US stocks has some investors ready to throw in the towel on global investing.
Click to enlarge
We think selling an asset after a stretch of lagging performance is a bad decision. Often, the lagging asset may be more attractive looking ahead. And that’s what we’re seeing in developed international stocks markets, where valuations are more attractive than in the US stock market.
Since 1990, non-US stock markets have outperformed the US market more than half the time. Since no one can be certain just when this will occur, we think it’s wise to own stocks in all regions.
A similar argument can be made for diversification by size. Large-cap US stocks trounced small- and mid-caps by 8.4 percentage points so far in 2014, but large-caps trailed smaller stocks by 11.7 percentage points annualized from 2001 through 2003. The key is to hold stocks across the size spectrum.
Diversification remains a fundamental tenet of smart investing—both as a way to manage risk and as a way to maximize return.
Source: Lessons Learned in 2014 by Seth J. Masters, Dec 10, 2014, Bernstein Global Wealth Management
Mr.Masters makes many compelling arguments. Now is not the time to sell foreign stocks.In fact, an investor who has cash to deploy can take advantage of the lower stock prices and add to their portfolios at current levels.
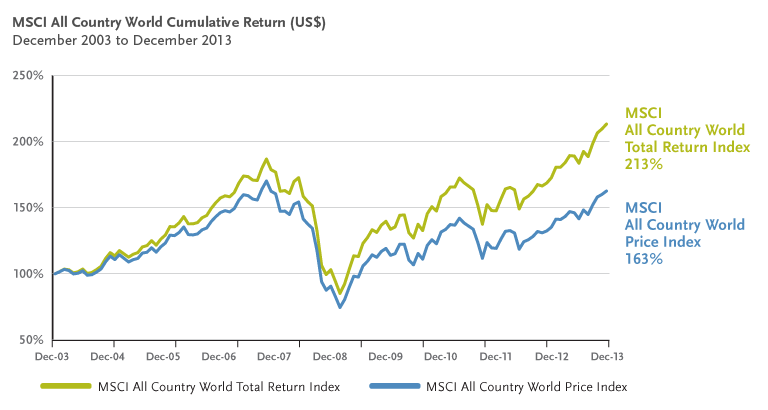
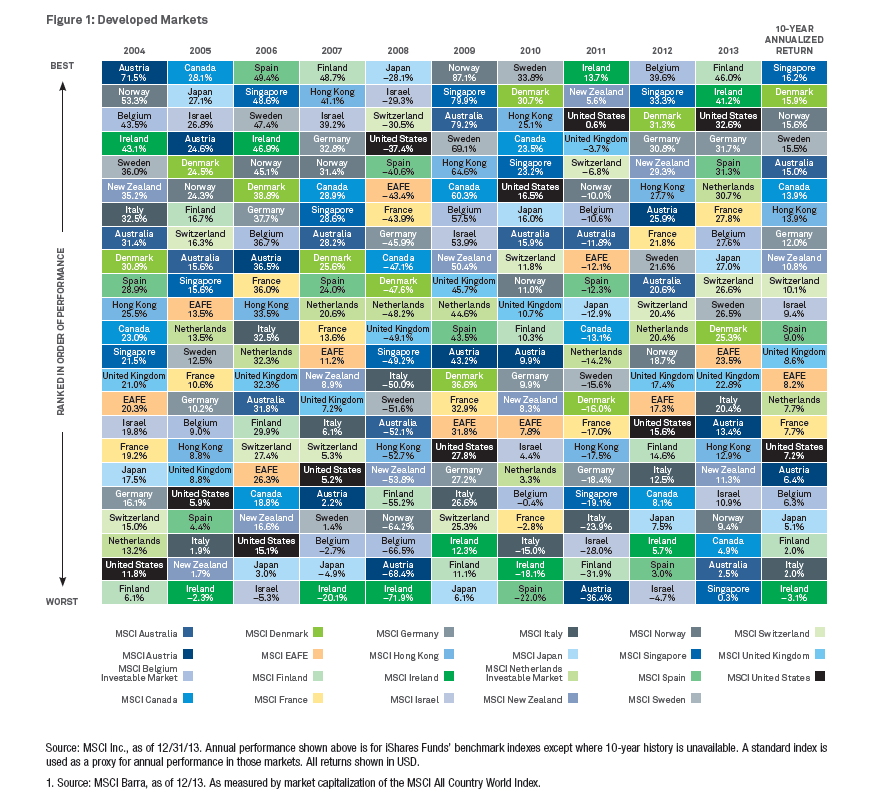
Moreover the 10-year annualized return (from 2004 to 2013) for U.S. stocks is only 7.2% based on the MSCI US Index. The 10-year annualized country returns for Denmark, Norway, Sweden and Switzerland easily beat the U.S. return with returns of 15.9%, 15.6%, 15.6% and 10.1% respectively. In addition. the U.S. was not the best performing market in any of the years during the period noted according to the Single Country Index Returns, Periodic Table of Investment Returns 2004–2013 by Blackrock.
Investors looking to diversify their portfolio can consider buying the following ten foreign stocks:
1.Company: Unilever PLC (UL)
Current Dividend Yield: 3.63%
Sector: Food Products
Country: UK
2.Company: Vodafone Group PLC (VOD)
Current Dividend Yield: 5.30%
Sector: Wireless Telecom
Country: UK
3.Company: Autoliv Inc (ALV)
Current Dividend Yield: 2.03%
Sector:Auto Components
Country: Sweden
4.Company: Nordea Bank AB (NRBAY)
Current Dividend Yield: 5.15%
Sector: Banking
Country: Sweden
5.Company: DBS Group Holdings Ltd(DBSDY)
Current Dividend Yield: 4.42%
Sector: Banking
Country: Singapore
6.Company:BASF SE (BASFY)
Current Dividend Yield: 4.33%
Sector: Chemicals
Country: Germany
7.Company:Air Liquide (AIQUY)
Current Dividend Yield: 2.52%
Sector: Chemicals
Country: France
8.Company: Novartis AG (NVS)
Current Dividend Yield: 2.94%
Sector: Pharmaceuticals
Country: Switzerland
9.Company: Roche Holding AG (RHHBY)
Current Dividend Yield: 3.24%
Sector: Pharmaceuticals
Country: Switzerland
10.Company: Anheuser-Busch InBev SA/NV (BUD)
Current Dividend Yield: 2.80%
Sector: Beverages
Country: Belgium
Note: Dividend yields noted above are as of Dec 23, 2014. Data is known to be accurate from sources used.Please use your own due diligence before making any investment decisions.
Disclosure: No Positions
Related:
If You Missed The Rally, Then You Just Made The Most Classic Mistake In Investing, Dec 23, 2014, Business Insider