Foreign Students In U.S. Universities and Colleges

The higher education industry one of the large industries in the U.S. The industry provides millions of jobs and more importantly creates billions of dollars worth of economic activity each year. For example, some college presidents make over $1.0 million per year in salary. All this money has to come from somewhere. One place where it usually comes from are the students.Tuition in U.S. universities continue to soar consistently year after year. For most of U.S. students the rising tuition leads to higher student loan debts.

One of the big source of revenue in terms of tuition and other charges for U.S. schools is foreign students. Hundreds of thousands of foreign students studying in these schools pay much higher tuition applicable to foreign students. Hence many universities prefer these students as they bring in much-needed cash to the university’s coffers.It is not unheard of some schools to reduce the number of domestic students in order to take in more foreign students.

In this post lets take a look at a few charts related to foreign students in U.S. higher education.

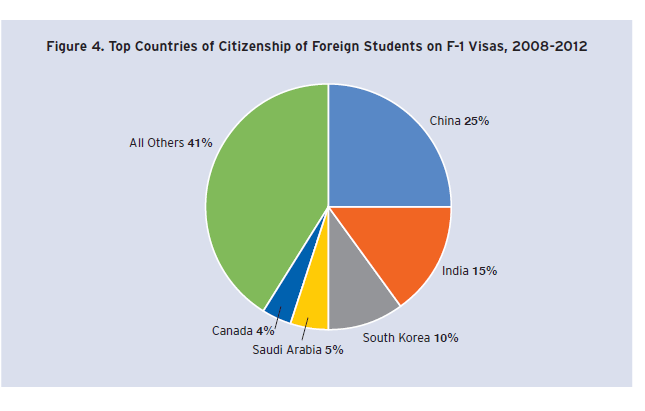
1) Top Countries of Foreign Students in U.S. universities:

Click to enlarge

Top Countries of Foreign Students

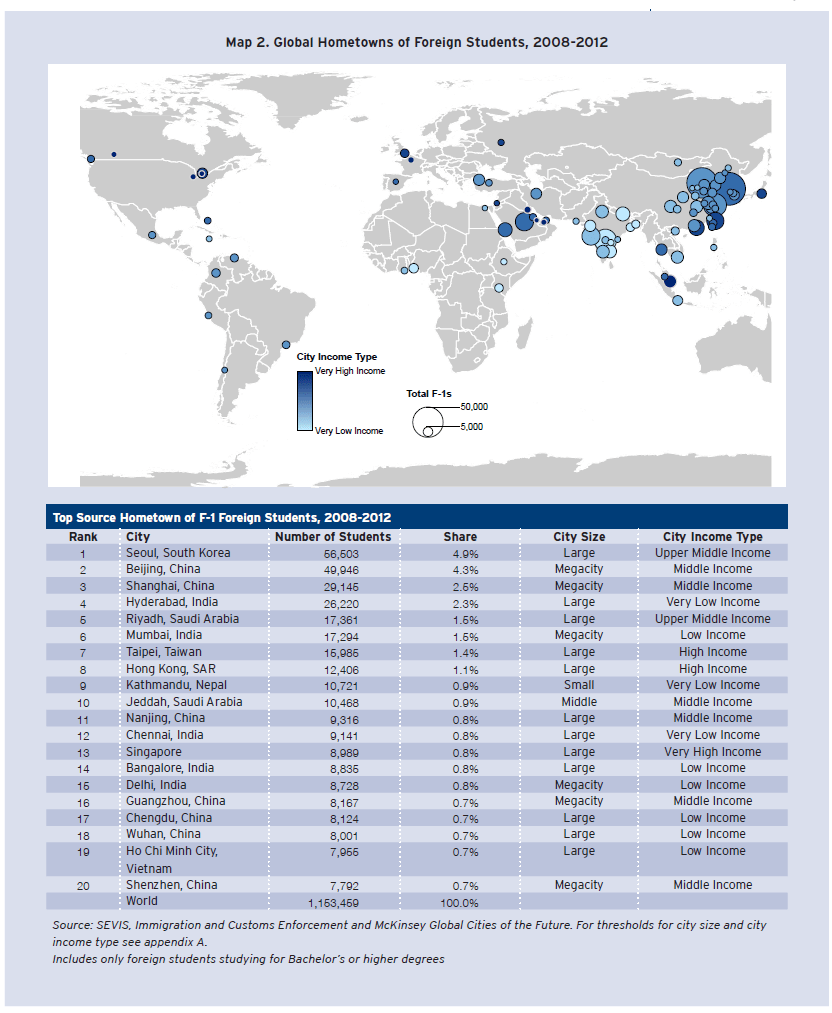
2) Top Hometowns of Foreign Students:

Top Source Home Countries of Foreign Students

3)Top Hometowns of Foreign Students in STEM(Science, Engineering, Technology and Mathematics) programs:

Top Hometowns of STEM foreign students

Source:  The Geography of Foreign Students in U.S. Higher Education: Origins and Destinations by Neil G. Ruiz, Aug 2014, The Brookings Institution

Countries From Which China Imports Energy Resources

As a emerging market superpower China is the largest consumer of many natural resource. China does not have huge crude oil resources and is a net importer of the black stuff.

The following chart shows the list of countries which supply crude oil and natural gas to China:

Click to enlarge

China Energy Import Countries


Source: Fueling a New Order? The New Geopolitical and Security Consequences of Energy, April 15, 2014, The Brookings Institution

Saudi Arabia is the largest supplier of oil to China followed by Angola in Africa and Iran. Most of the crude oil and natural gas are shipped by sea to China.In the Western hemisphere Venezuela and Brazil are major source countries for China’s energy imports but not Canada.Since the U.S. and Canadian economies are highly integrated, Canada sends much of its crude oil to the U.S. via pipelines and rail making it the largest trading partner of the U.S. The U.S. does export oil to other countries due to a ban on exports.

The Top 10 Trade Partners of Greece

Greece is on the southern end of Europe and has an archipelago of 2,000 islands. The economy is a medium size economy in Europe with an estimated GDP of $267.0 billion based on Purchasing Power Parity. Greece has democracy as the political system and a free market capitalist economy. One of the major negative factors for Greece is the size of the public sector in the economy.The public sector accounts for about 40% of the GDP.

The Top 10 Export Partners for Greece are shown below:

Click to enlarge

Greece-Top 10 Export Partners

The top three export destinations for Greek products are Turkey, Italy and Germany. The major export products are oil and mineral fuels, aluminium and electrical machinery.

The Top 10 Import Partners for Greece are shown below:

Greece-Top 10 Import Partners

The top three source countries for imported goods are Russia, Germany and Italy.

Note: Data shown are 2012 data from the UN.

Source: Global Edge, Michigan State University

Differences and Similarities Between Major Frontier Market Indices

Frontier markets refer to all markets that are not developed or emerging. These markets include places like Ecuador, Nigeria, Namibia, Iran, etc. The following map shows the countries that are considered as frontier markets by the global investment community:

Click to enlarge

Frontier Markets Map

Source: WSJ Graphics

According to a research report by Ben Garland and Kelvin Dell of Blackrock, index providers classify countries as developed, emerging or frontier  based on three factors: economic development, market size and liquidity and accessibility to international investors. Frontier markets are characterized by the lowest of these factors relative to the developed and emerging equity markets.

The frontier universe is comprised of 40 countries. However the assignment of a market as frontier differs between the index providers as the  table below shows:

Click to enlarge

Frontier markets Index Comparison

Source:  Crossing the Frontier, Blackrock

NOTE: In Septmeber 2014, FTSE downgraded Morocco from “secondary emerging market” to frontier market status and excluded Argentina from the Frontier Markets index.

Among the four index providers the index by MSCI is the most widely used.In May 2014, MSCI upgraded Qatar and UAE to emerging market status. After this reclassification the regional allocation of the index looks like shown below:

MSCI Frontier Markets Index Composition

At a global level frontier markets are tiny in terms of global market capitalization.

Frontier Markets GDP and Market Cap

The main competition to the MSCI index is the index created by FTSE. For example, in 2013 Vanguard switched their benchmark indices from MSCI to FTSE. I wrote an article comparing the key differences between MSCI and FTSE indices at that time.

Below are some of the differences and a few similarities between the MSCI Frontier Markets Index and FTSE Frontier Markets Index:

  1. The MSCI index has 26 countries in the index but FTSE has only 24. Both the indices give big weightage to Nigeria and middle eastern markets.
  2. Despite a high standard of living and a GDP per capita of $48,000 in 2013, Kuwait is assigned the frontier market status by both MSCI and FTSE because of strict foreign ownership limits in Kuwaiti companies and underdeveloped operational infrastructure.
  3. The evolving markets of Vietnam and Bangladesh are both included in the MSCI and FTSE indices.
  4. Natural resources plays a major in many of the frontier markets. For instance, Nigeria is a major oil producer, Argentina is a major food producer, Ukraine producers iron ore, Zambia is a major copper producer and Vietnam is a leading coffee exporter.
  5. With respect to small economies, the FTSE Index includes countries such as Bulgaria, Botswana, Cyprus and Macedonia while the MSCI Index includes Kuwait, Morocco, Lebanon and Ukraine.
  6. The top 10 markets in the FTSE index is dominated by Nigerian and Qatari companies while the top 10 of the MSCI index is concentrated in Nigerian and Kuwaiti firms.
  7. The selection criteria between MSCI and FTSE varies. From an article in The Wall Street Journal: ” The differences between the two company’s country choices are primarily the result of the selection criteria they use. MSCI considers a country’s accessibility for international investors, the liquidity of its market and its economic growth. In FTSE’s case, for a country to be classified as frontier it needs to meet some crucial points: a formal stock market, few restrictions on capital repatriation and low occurrence of failed trades.”

Sources:

FTSE’s New Frontier Indices Take Aim at MSCI Standard, Sept 11, 2014,  The Wall Street Journal

New FTSE Frontier Markets Index is not very good, here is why, Sept 18, 2014, Investment Frontier

Related ETFs:

  • Guggenheim Frontier Markets ETF (FRN)
  • iShares MSCI Frontier 100 ETF (FM)
  • PowerShares MENA Frontier Countries ETF (PMNA)
  • Market Vectors Africa ETF (AFK)

Disclosure: No Positions