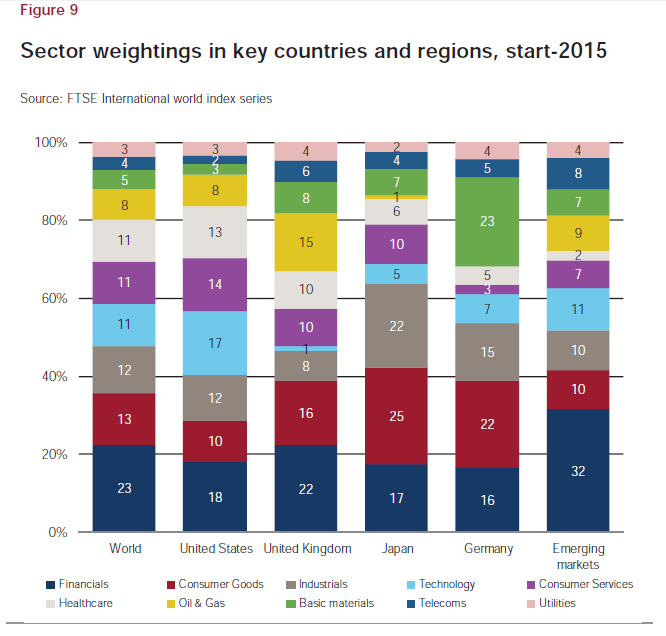
Despite High Volatility Stock Market Continues To Move Higher

The S&P 500 and Dow Jones closed at all-time records of 2,078 and 17,959 respectively yesterday.However this is the fifth recovery this year for the S&P 500 according to an article in Bloomberg.

From the article:

Today’s gains in the S&P 500 completed the fifth recovery this year from a decline of 4 percent or more, just 17 days after it started. In comparable drops beginning in January, April, July and September, the S&P 500 needed about a month to erase losses, data compiled by Bloomberg show.

This is the 50th time this year the S&P 500 has closed at an all-time high, while the Dow has done it 35 times. The S&P 500 reached records on 45 occasions in 2013, as the index recovered from the financial crisis to top its previous high from October 2007 for the first time.

The latest rebound gives the S&P 500 a gain of 5.4 percent for the month so far. The index has advanced in each of the past six Decembers, climbing an average 2.2 percent.

Source: S&P 500 Climbs to Record After 3-Day Rally on Surge in Tech Shares, Dec 22, 2014 Bloomberg

To put the S&P figure in perspective, the index reached a low of 666 in March 2009 during the peak of the Global Financial Crisis.It has more than tripled from that trough.While for most of the investors it does not feel like a bull market obviously this is a bull market.However unlike a “normal” bull market it has not been a smooth sailing for equity markets during this current run up. Since 2010, investors have had to experience gut-wrenching market corrections almost every year with one geo-political risk after another taking center stage as the chart below shows. Despite all the corrections the equity market continues to soar higher. The recent crash in oil prices also seems unlikely to reverse the upward trend.

Click to enlarge

US Stock Market Swings

Source: Global Investment Outlook, New Year 2015, RBC Global Asset Management Inc

The key takeaway for investors is that markets always go higher despite short-term volatility. So investors have to invest for the long-term by holding high-quality stocks that can withstand risks.

Related ETFs:

  • SPDR S&P 500 ETF (SPY)
  • S&P MidCap 400 SPDR ETF (MDY)
  • SPDR Consumer Discretionary Select Sector SPDR Fund (XLY)
  • SPDR Consumer Staples Select Sector SPDR Fund (XLP)
  • SPDR Energy Select Sector SPDR Fund (XLE)
  • SPDR Financials Select Sector SPDR Fund (XLF)
  • iShares Dow Jones Select Dividend ETF (DVY)
  • Vanguard Dividend Appreciation ETF (VIG)

Disclosure: No Positions

Updates:

The Top 100 Non-Financial Firms Ranked By Foreign Assets 2013

The ING Erasmus Top 100 was published by the Rotterdam School of Management in Dec, 2013. The list comprised of the top 100 non-financial firms ranked by foreign assets.

The top 20 firms from the ranking is shown in the table below:

RankCompanyCountryIndustryForeign Assets in 2013 (USD millions)
1General ElectricUSAConglomerate338,157
2Royal Dutch/ShellUK-NetherlandsOil & Gas307,938
3BPUKOil & Gas270,247
4Toyota MotorJapanAutomotive232,749
5TotalFranceOil & Gas214,328
6VodafoneUKTelecommunications195,630
7Exxon MobilUSAOil & Gas195,046
8GDF SuezFranceElectric Utilities174,911
9ChevronUSAOil & Gas158,865
10CNPCChinaOil & Gas158,775
11VolkswagenGermanyAutomotive157,914
12ENIItalyOil & Gas132,666
13NestléSwitzerlandConsumer Goods132,501
14E.OnGermanyElectric Utilities128,203
15AB InBevBelgium-BrazilBeverages & Tobacco115,913
16EnelItalyElectric Utilities115,331
17ArcelorMittalLuxembourgSteel112,239
18SiemensGermanyConglomerate111,986
19Honda MotorJapanAutomotive110,265
20MitsubishiJapanAutomotive109,449

Source: ING Erasmus 100,Rotterdam School of Management, ING Economics Department, December 2013

The U.S. had the most number of firms in the list with 23 firms.The majority of the 100 companies are from the US, Developed Europe and Japan.

It is not surprising to see oil and auto companies top 20 shown above. The full list of rankings can be found in the link above.

The Top 10 Global Companies Based on Foreign Sales

Some of the multinational firms derive a very high percentage of sales relative to total sales from countries outside of their home countries.Ten such firms from the ING Erasmus 100 Top International Firms published in Dec 2013 are listed below:

RankCompanyForeign Sales/Total Sales (in 2013)
1Roche Group98.90%
2Novartis98.80%
3Liberty Global98.60%
4SAB Miller98.40%
5Nestlé98.40%
6Royal Philips97.30%
7Hon Hai Precision97.20%
8Teva Pharmaceutical96.90%
9Barrick Gold96.60%
10Rio Tinto96.20%

Source: ING Erasmus 100,Rotterdam School of Management, ING Economics Department, December 2013

Pharmaceutical companies dominate the list with Swiss-based Roche Group(RHHBY) having almost all of its sales outside Switzerland.The world’s largest generic drug market Teva(TEVA) of Israel also high foreign sales.According to the authors of the report:

US firms score relatively low on this ranking due to their large home market. Firms like Wal-Mart, General Motors, Ford, Microsoft and PepsiCo all obtain less than half of their sales abroad.

Disclosure: No Positions

How To Profit From Lower Oil Prices

Oil prices have been stable up until recently at around $110 price per barrel and $100 seemed to be the floor.However since mid-June this year prices have plunged dramatically to below $60 per barrel. On Friday Brent crude oil closed at  $61.38 for February, 2015 delivery on the NYMEX.

There are many ways to profit from the decline in oil prices. One way is to buy the stocks of major oil producing giants such as BP Plc(BP), Royal Dutch Shell PLC (RDS.A, RDS.B), Exxon Mobil Corp (XOM), Total SA (TOT), etc as their stock prices are cheaper at current levels and they have attractive dividend yields as well.This strategy is not the best move since there is no guarantee that oil prices will quickly recover and dividend payments may be cut when earnings take a hit. A better way to take advantage of the lower oil prices is to invest in companies operating in the consumer staples and consumer discretionary sectors. As consumers spend less on gasoline they are left with extra cash to spend on consumer goods and services.

From a recent article by UK-based Clare Hart, Manager of the JPMorgan US Equity Income Fund:

Given the significant recent decline in oil prices and subsequent market volatility, it is worth considering what this means for investors in US equities.

With the exception of the very end of last week, US equity markets have for the most part continued to grind higher as investors have shrugged off the vicious collapse in crude oil prices and instead focused on increasing central bank accommodation and continued strength in the US economy.

In our view, lower oil prices should also act as a beneficial tail wind for the US consumer. US families with income below $50,000 (£32,000) on average spent about 20-25 per cent of their total household income on energy.

Further, approximately 60 per cent of Americans spent nearly 15 per cent of their discretionary spending on gas. Lower energy bills should leave consumers with more dollars in their pockets to spend on goods and services, which should benefit overall consumer spending.

Source: What falling oil prices can mean for US equity dividend investors, Dec 19, 2014, Money Observer

Generally one could go no wrong investing for the long-term in consumer staples companies.Even when gasoline prices were much higher they were able to generate solid earnings and pay decent dividends consistently.

Ten U.S. stocks in the consumer staples sector are listed below with their current dividends for consideration:

1.Company: Kellogg Co (K)
Current Dividend Yield: 2.93%
Sector:Food Products

2.Company: General Mills Inc (GIS)
Current Dividend Yield: 3.05%
Sector: Food Products

3.Company:Colgate-Palmolive Co (CL)
Current Dividend Yield: 2.06%
Sector: Household Products

4.Company:Procter & Gamble Co (PG)
Current Dividend Yield: 2.80%
Sector: Household Products

5.Company: Mondelez International Inc(MDLZ)
Current Dividend Yield: 1.61%
Sector: Household Products

6.Company:Kraft Foods Group Inc(KRFT)
Current Dividend Yield: 3.46%
Sector: Household Products

7.Company:Campbell Soup Co(CPB)
Current Dividend Yield: 2.82%
Sector: Household Products

8.Company: ConAgra Foods Inc(CAG)
Current Dividend Yield: 2.71%
Sector: Household Products

9.Company:The Clorox Co (CLX)
Current Dividend Yield: 2.83%
Sector:Household Products

10.Company: Kimberly-Clark Corp (KMB)
Current Dividend Yield: 2.90%
Sector: Household Products

Note: Dividend yields noted above are as of Dec 19, 2014. Data is known to be accurate from sources used.Please use your own due diligence before making any investment decisions.

Disclosure: Long GIS

A Note On The Market Capitalization Of Russian Stock Market

The stock market capitalization of the Russian is small compared to the U.S. market. The total market cap of the US market is in the Trillions of dollars while the Russian market is just a couple of hundred billion dollars. Back in January The Economist published the following graph showing the market caps of select countries:

Click to enlarge

Russia Market Cap

Source: The Economist

At that time the market cap of Russian market was about $223.0 billion which was equivalent to the market cap of Proctor & Gamble (PG) at that time. By November this year, the market cap of tech giant Apple (AAPL) exceeded that of the Russian market as the share prices of Russian stocks fell. As we approach the end of the year, Russia has been hit hard by the crash in crude oil prices. Russian oil companies such as Gazprom(OGZPY) and LUKOIL (LUKOY), dominate the equity market and oil and natural gas are the major exports of the country. A recent article in Marketwatch noted that the market cap of Google(GOOG) is bigger than the entire Russian equity market.

Goog-Russia Market Cap


Source: Google is now bigger than Mother Russia’s entire market,  Dec 18, 2014, Marketwatch

Related ETF:

  • Market Vectors Russia ETF (RSX)

Disclosure: No Positions