India’s benchmark Sensex is flat so far this year as of May 15th. The MSCI India Index is up by just 0.37% based on US dollar terms.
India was one of the top performing markets in 2014 but that is not the case this year. For example, among emerging markets, China’s Shanghai Composite has shot up by 33.2% and Brazil Bovespa is up by 14.5 % year-to-date (YTD).
From an investment standpoint, investors may be wondering if Indian stocks are cheap now since the equity markets of China and Brazil and even Russia have grown substantially higher relative to India (YTD). The answer is not easy to figure out. Adrian Lim, Senior Investment Manager of Aberdeen Asset Management noted in an interview last month that valuations are Indian equities are reaching historic highs.
From the report:
Click to enlarge
How have Indian equities performed this year?
Cheaper energy prices, lower inflation, and the steady pace of economic reforms, have been good for share prices. The MSCI India index is up 10.3% in the year to date (as at 27 March in local currency terms). As a result, Indian equities are trading near their historical highs, at 19.0 times FY2015 earnings. We’ll need to see further signs of economic growth to support better margins and earnings.
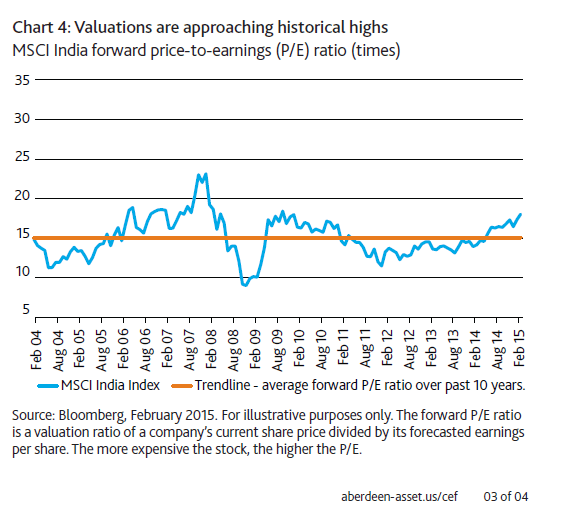
Source: Aberdeen Indian Equities, April 2015
The above chart shows that forward P/E ratio is reaching historic levels reached during late 2007-08 before the global financial crisis. So based on this factor, Indian stocks are not cheap now.
However there are many other factors that can be used to calculate equity valuations. Based on other factors such as the Market Cap to GDP, Indian stocks are not in a bubble according to a recent article in The Hindu Business Line. This valuation metric is a favorite of Warren Buffet. In a 2001 Fortune interview he stated “it is probably the best single measure of where valuations stand at any given moment.”
From the Business Line article:
Valuation provides comfort
The Nifty was trading at a price to earnings (PE) multiple (trailing 12 months) of 22 towards the end of April this year. This is higher than the five-year average PE multiple of around 19 but much below the peak valuations hit before the 2008 and 2000 peaks.
Before the market sold off in 2008, the Nifty was trading at a much higher multiple of 27.6 times. In February 2000, before the dotcom bubble burst, the Nifty was trading at a multiple of 28.4 times.
The estimated forward PE multiple for the Nifty for FY16, at around 15.5 times, too lends comfort.
If we measure Nifty’s valuation on the price to book ratio, it was available at 3.5 times book value towards the end of this April. The ratio has not changed much since the end of December 2012 when the Nifty was trading at 3.13 times its book value; despite the 38 per cent rally in the index since then. It implies that the growth in India Inc’s net assets has kept pace with the increase in stock price over the last two years.
On a price-to-book metric too, the Nifty has not reached peak valuation yet. In December 2007, this ratio was 6.4 and in February 2000, it was 5.1.
Market capitalisation to GDP ratio is another metric that can be used to judge if the market has turned expensive. A ratio of around 1 implies that the market is rightly valued whereas a value below 1 signals room for growth. Currently, the market cap to GDP ratio is 0.87, which signals absence of a bubble.
According to the World Bank, India’s market cap to GDP was 1.47 in 2007, when the bull market was at its fiercest. That was a clear sign of an overheated market, waiting to fall. In 1999, this ratio was just 0.39, probably due to fewer stocks in the listed universe at that point. This number is, therefore, not comparable.
Source: End of bull run? by Lokehswarri, The Hindu Business Line
The Nifty is the other benchmark index for Indian equity market created by the National Stock Exchange of India.
In summary, Indian equities can be considered as fairly valued now. Unless economic reforms are implemented faster and corporate profits increase from the current tepid levels, stocks may find it harder to climb higher from current levels.
Twelve Indian firms trade on the US markets as ADRs. According to an article in the latest edition of Bloomberg BusinessWeek, foreign investors are flocking to HDFC Bank(HDB), one of India’s largest private sector banks. From the article:
It’s hard to overstate just how much global investors are captivated by HDFC Bank Ltd., India’s biggest lender by market value.
Not only does the stock trade at the highest valuation among the world’s largest banks, but international funds are so bullish that they’re willing to pay a record 20 percent premium over HDFC’s local stock price to get their hands on the limited number of shares available to foreigners. Brokerage analysts, meanwhile, have more buy ratings on the company than at any other time in 14 years.
Source: World’s Most Expensive Bank Is a 20%-a-Year Growth Machine, Bloomberg Business
You may also want to read the “Reform is the only answer to India’s growth-inflation problem” piece by Shumita Sharma Deveshwar of Trusted Sources published ealier this month on FT beyondbrics blog.
ETFs: The Complete List of India ETFs and ETNs Trading on the US Markets
Disclosure: No Positions