Wheat is the most important food source for humans. The U.S. is the 3rd largest producer of wheat.
Click to enlarge

Source: FAO
Wheat is the most important food source for humans. The U.S. is the 3rd largest producer of wheat.
Click to enlarge
Source: FAO
Interesting graphic on milk. India is the largest producer of milk followed by the U.S.
Click to enlarge
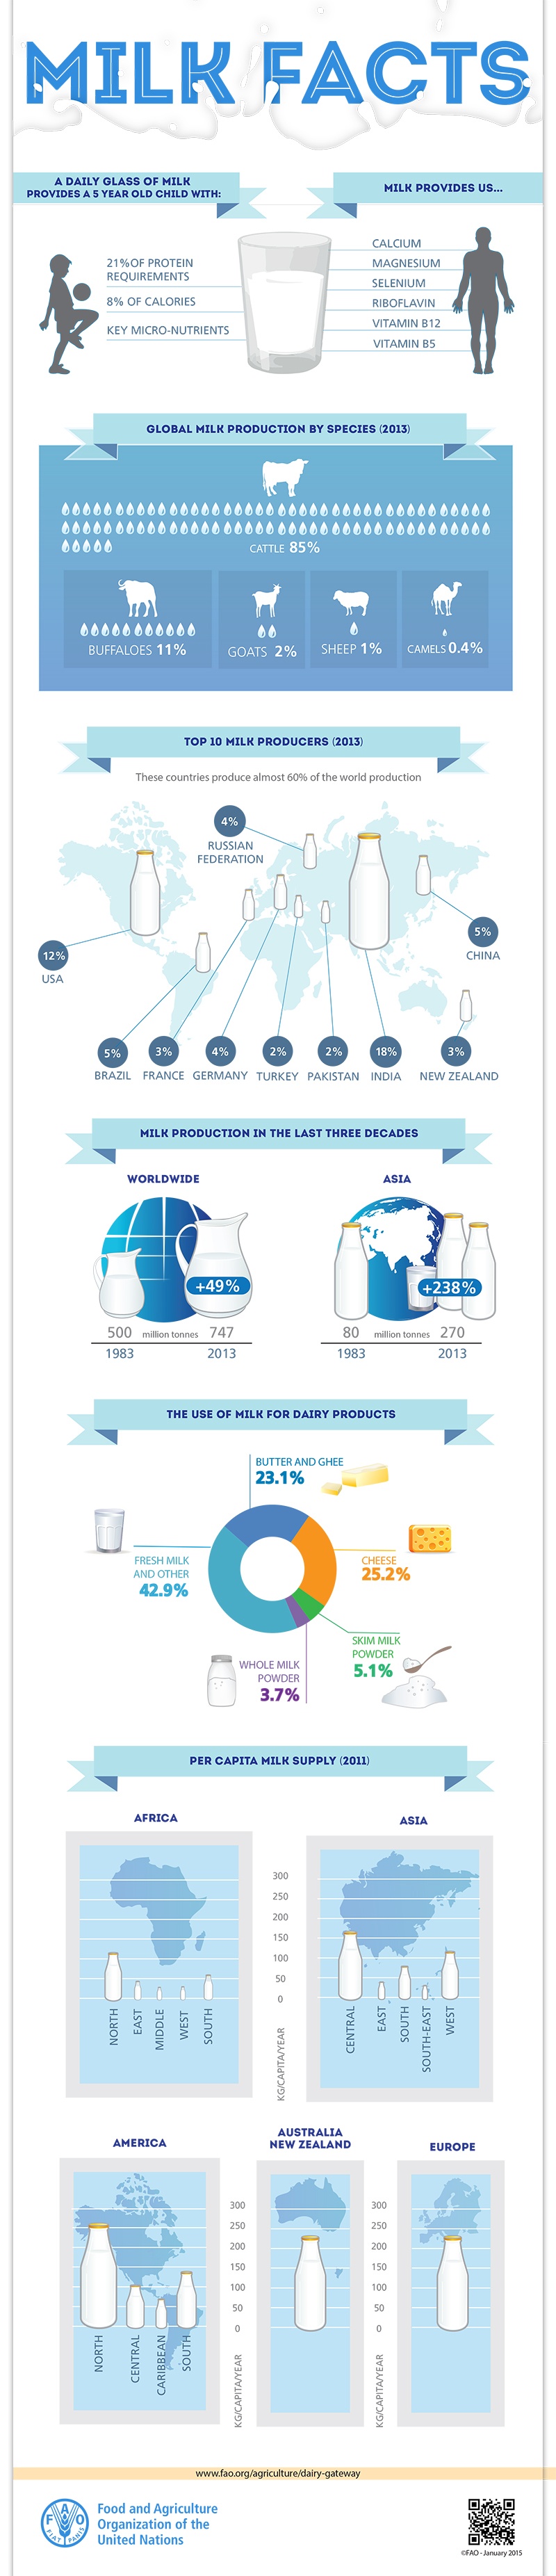
Source: FAO
Piles of Overseas Profits Investors Can See but Not Touch (NY Times)
Sweden are Eurovision 2015 winners – full results (Daily Mirror)
Autralia – Are we still the lucky country? (News.com.au)
Why China’s astonishing rally has further to run (CityWire) Also see No bubble in China despite 200% in a year, says Mathews Asia (FE Trustnet) and SHOULD INVESTORS FOLLOW THE CHINA IN-CROWD? (Money Observer)
Opinion: San Diego is about to get hosed by the Chargers and the NFL (MarketWatch)….example of one of the biggest scams that occur in most big U.S. cities in plain sight year after year.
Click to enlarge

Amphibious Helicopter MI-14
Photo Courtesy of:English Russia
Infographic showing the world’s top producers of cocoa and the top importers and exporters of chocolate products.Africa accounts for more than half of the world’s cocoa production.
Click to enlarge
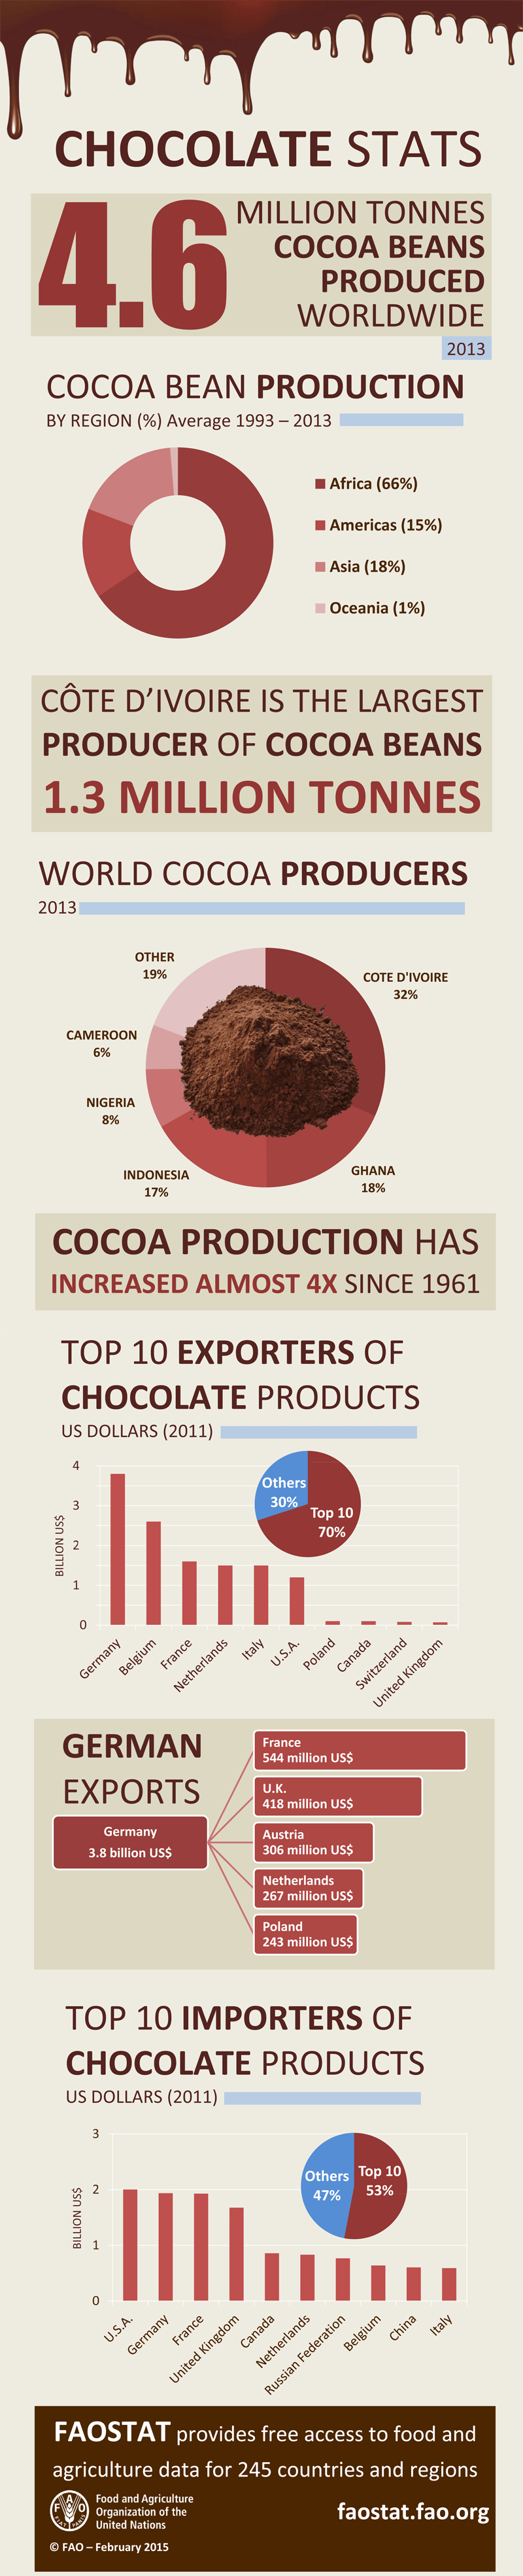
Source: FAO
The US Dollar is one of the seven reserve currencies in the world. Unlike in the past, the dollar today is not backed not anything but the full faith and trust of the U.S. government. Essentially the dollar and other reserve currencies are just a pieces of paper similar to other currencies like the Ukraine Hryvnia, Botswana Pula, Croatian Kuna, Swailiand Lilangeni, Bhutan Ngultrum, etc. However the dollar and other reserve currencies are valued more in the global market.
The majority of the world’s currency reserves are held in US dollars and is the preferred currency in global trade.However the dominance of the dollar in trade may be in decline as countries and international groups are switching from dollar to national currencies in trade.
The following infographic offers interesting insights on the ongoing evolution of trade in currencies other than the dollar:
Click to enlarge
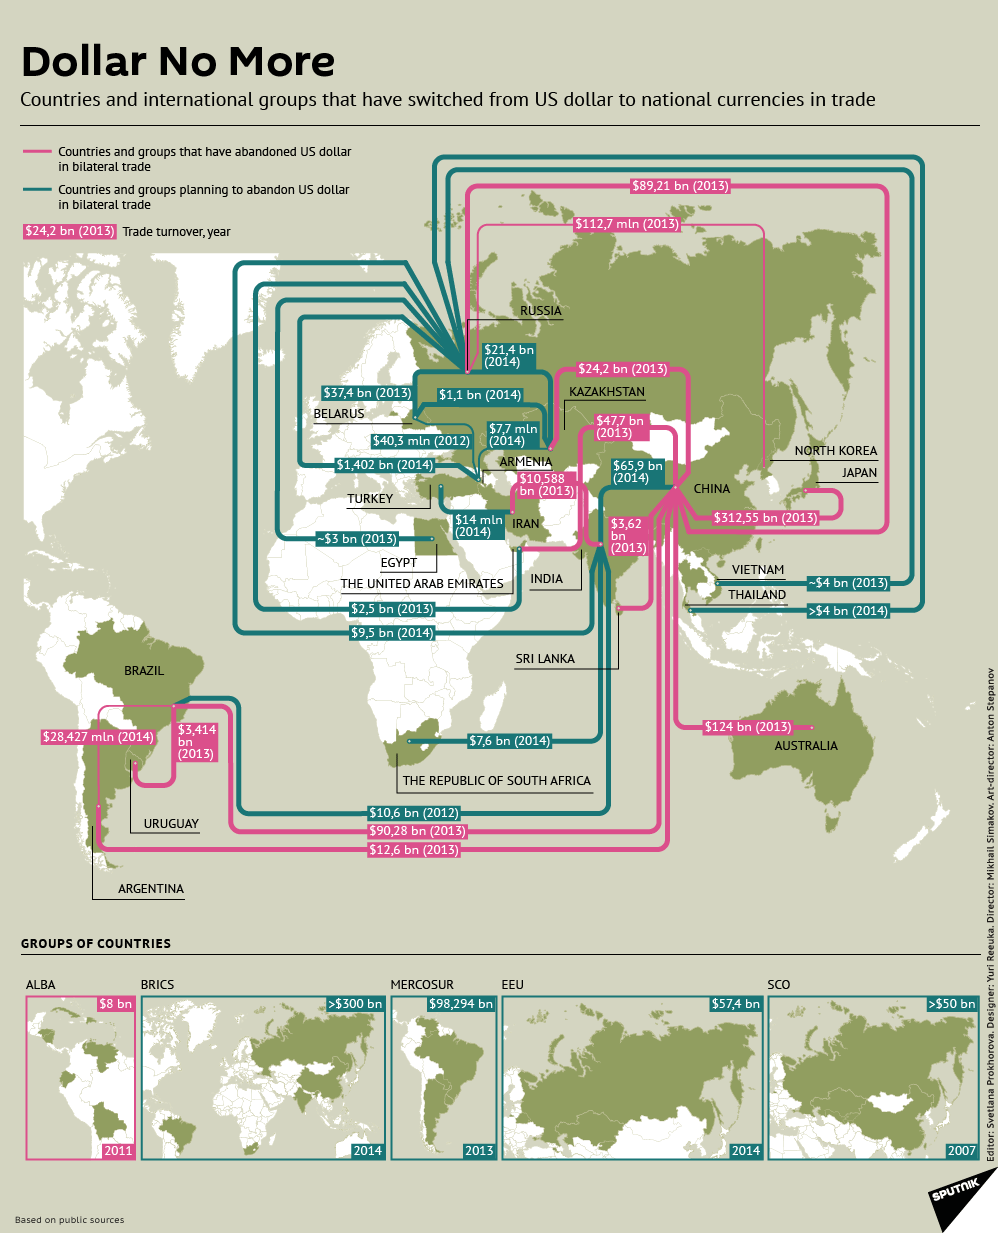
Source: Sputniknews