Chinese equities have been on a roller coaster ride for the past few months. Since reaching the peak in June this year, the Shanghai Composite Index has fallen by 29%. However despite this plunge, Chinese stocks are still in the positive territory for this year.
In a Guardian article on the Chinese equity market crash and its impct on the real economy, author Heather Stewart quoted IMF’s Managing Director Christine Lagarde’s views on thi topic. From the article:
Christine Lagarde, the managing director of the International Monetary Fund, played it cool when asked about the Chinese market gyrations in a press conference on Wednesday. She pointed out that the market was still up an extraordinary 80% over the past year, and added she was not surprised the government in Beijing was intervening to prevent the “disorderly functioning” of markets.
“That is the duty of central authorities,” she said. “The fact that they want to maintain a level of liquidity that is commensurate with an orderly process is quite good.”
In other words, while some have condemned Beijing’s efforts to arrest the share slide as clunky and authoritarian, Lagarde saw it as little different to the scramble by western governments during the 2008 crisis to prevent their financial systems from seizing up.
She was relaxed, too, about the potential impact of the share price slide on China’s real economy – the shops, factories and farms that create jobs and generate growth. “We believe that the Chinese economy is resilient and strong enough to withstand that kind of significant variation in the markets,” she said.
Source: As Chinese shares fall, the real fear is that the economy itself is grinding to a halt, The Guardian
I agree with Ms.Lagarde. The Chinese “real” economy is unlikely to be impacted adversely by the ongoing chaos in its equity market. This ie because despite the media hype, equity market participation by domestic investors in China is still low relative to other countries especially developed countries like the U.S.
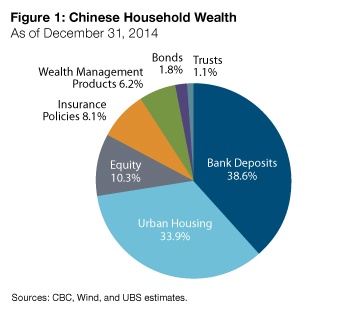
In an insight.ful article, Anh Lu and Chris Kushlis T.Rowe Price note that the crash in Chinese equities is projected to have a limited impact on households since equities sccount for a small portion of Chinese household assets.
Click to enlarge
Source: Economic Risks From China Equity Decline Appear Manageable, T.Rowe Price
Chinese households hold most of their assets in property and bank deposits and not in equities. Hence the correction in stock market should have low impact on households. Despite the media hype, fall in equity prices is unlikely to lead to negative predictions such as the collapse of the economy, the regime losing control of the state, mass panic, riots, failures of financial institutions, the economy plunging into a depression, etc.