Here is an infographic showing the Top 40 Retailers in Asia:
Click to enlarge
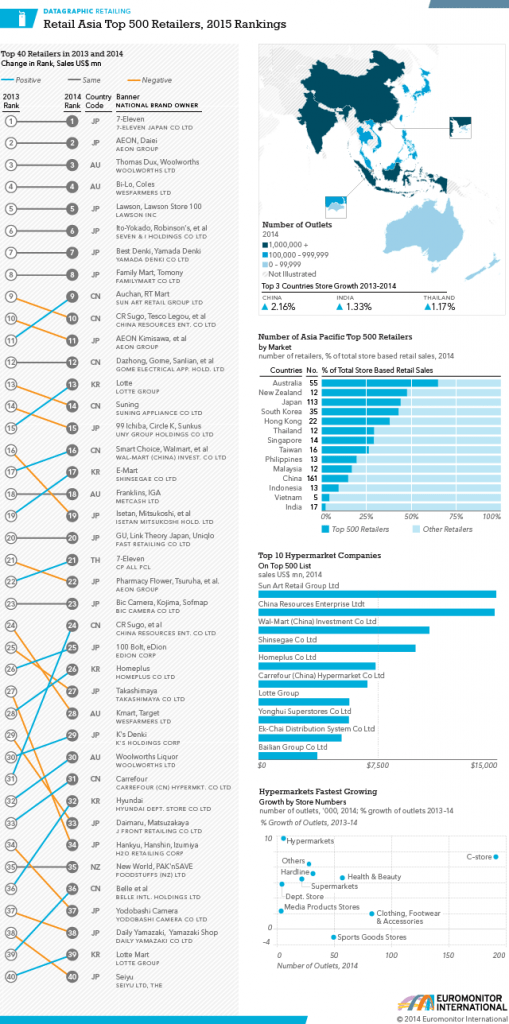
Source: Euromonitor International
In 2014, the top 500 Asian retailers had sales of US $1.1 Trillion. Japanese companies dominate the top 10 list as they have consolidated in the local market and expanded in regional markets as well.Walmart’s (WMT) China subsidiary ranks third in the top hypermarket category.
Disclosure: No Positions