How Much Exposure Do European Banks Have To Greece ?

European equities have fallen heavily in the past few weeks from their 2015 peaks due to the Greek debt crisis. For example, the DAX has declined from 12,390 in April to 10,667 today.

As of July 7 close, the returns of the major indices are listed below:

  • S&P 500 Index: 0.5%
  • UK’s FTSE 100: -0.50%
  • France’s CAC 40: 10.3%
  • Germany’s DAX Index: 11.1%
  • Spain’s IBEX35 Index: 2.5%

Unlike during the past European sovereign debt crises, this time around many doom and gloom scenarios are being discussed by investors and experts alike. Some of these scenarios include the collapse of Greek banks, collapse of Greece, Grexit, Greece going back to Drachma, Greece aligning itself with Russia, other Eurozone countries like Italy, Spain, etc. quitting the EU, etc. All these are just hype and are unlikely to occur.

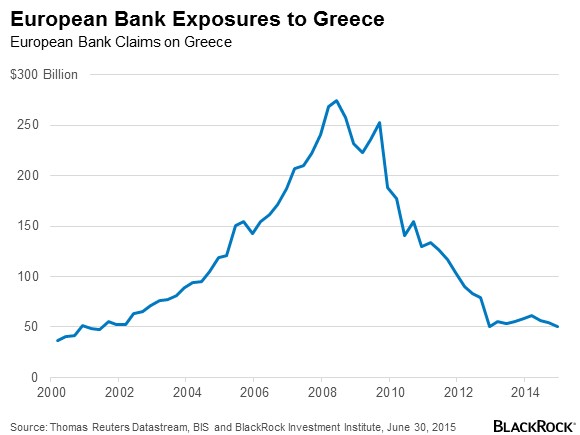
With respect to European banks’ exposure to Greece, it is not a doomsday scenario either. Russ Koesterich, Global Chief Investment Strategist of Blackrock noted this point in a post today. European banks have substaintially reduced their exposure to Greece in the past few years. Most the Greek debt is held by official creditors and not private banks. These major creditors include the troika – the European Central Bank (ECB), IMF and European Commission.

Click to enlarge

European-Bank-Exposure-to-Greece-Chart

Source: Does Greece Pose a Threat to Global Markets?, Blackrock blog

From an investment perspective, investors need not fear holding or investing in European stocks especially banks. Though short-term volatility is normal, European banks are good long-term investments at current levels.
Knowledge is Power: Fracketeering, US Stocks, Fracketeering Edition

Click to enlarge

Sears Tower, Chicago

Sears Tower, Chicago

Six Facts About Greece

The greek debt drama continues to drag on with no end seem to be sight. Now that the Greeks have voted “no” to creditors’ demands in the referendum yesterday, the country faces a difficult future ahead.

Today the OECD released a report titled “Government at a Glance 2015” comparing the performance of public sector across countries.The following are key points about Greece from this report:

Budget Balance: Greece ran a budget surplus of 0.4% of GDP in 2014. This is a welcome development
since many countries ran a budget deficit last year.However if interest payments on public debt
are included, Greece ran a budget deficit of 3.5% of GDP in 2014.

Public Spending: Public expenditures dropped significantly since 2009 in per capita and as a percentage of
GDP in 2014. Greece spent US$12,942 per capita in 2014 compared to $16,643 in 2009.As a share of
GDP, government spending decreased from 54.0% in 2009 to 49.3% in 2014. This is also a step
in the right direction.

Public Debt: Public debt reached 181% of GDP in 2014. This figure is much higher than the
OECD average of 109%. So despite years of austerity, Greece’s public debt remains too high.

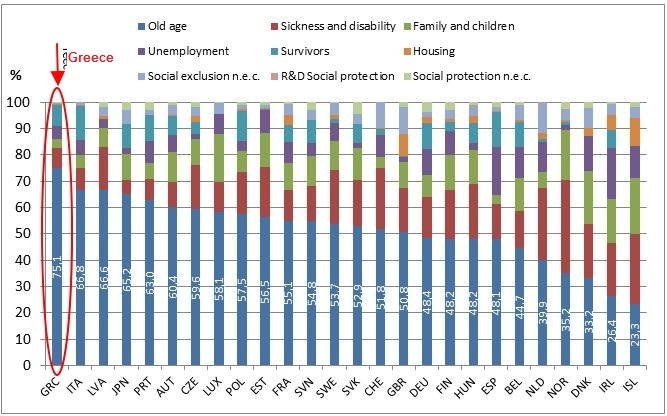
Old age pensions: This accounted for 14.4% of GDP in 2013 or about three quarters of social protection
as shown in the chart below. Spending on pensions is the highest share among OECD countries.

Click to enlarge

Social-protection-in-OECD
Sources: OECD National Accounts Statistics (database); Eurostat Government finance statistics (database). Data for the OECD non- European countries (apart from Japan) and for Turkey are not available. Iceland and Spain: 2012.

Public Sector Employment: Between 2009 and 2013, public sector employment decreased from
by 2.4% from 19.7% to 17.5% of the total work force. This is the highest decreased OECD countries.

Public Procurement: Greece has the lowest public procurement expenditure in relation to GDP (9.8%).

Source: The facts about Greece, OECD Insights Blog

US Bank Stocks Are Cheap On Valuation

Ever since the Global Financial Crisis of 2008-09, some investors have avoided bank stocks. However that need not be the case as most banks have cleaned up their balance sheets and are in a much healthier shape now. In fact, on a global level US banks are stronger now than their developed world peers.

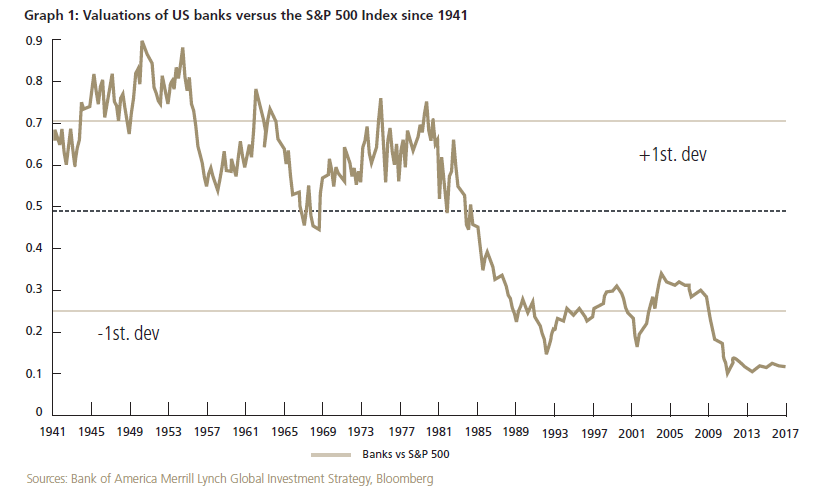
The S&P 500 is flat year-to-date. But the KBW Bank index is up by 3.5%. According to an article by Lisa Haakman of PSG Asset Management of South Africa, many of the global developed market banks are now unloved and also undervalued. She noted that US banks are trading at 70 year lows based on valuation relative to the S&P 500 as shown in the chart below:

Click to enlarge

US Banks Valuation

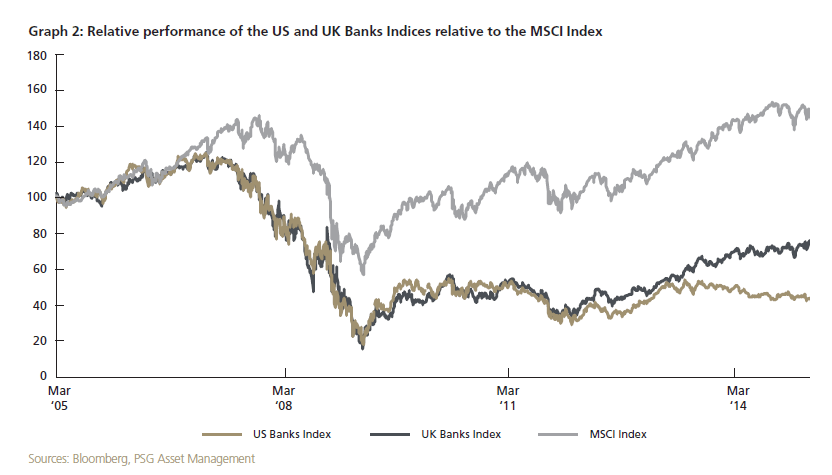
Over the shorter period of 10 years, US and UK banks have significantly under-performed the MSCI Index.

US and UK Banks vs MSCI Index

Source: Angles & Perspectives, Q1 2015, PSG Asset Management

As the developed economies continue to grow, banks are bound to benefit.In the US, low unemployment rate is already helping lenders grow their  loan portfolios. All types of credit such as student loans, auto loans, mortgages, and credit card loans are growing as confident consumers increase their spending. In addition, banks have loosened the underwriting standards in order to make credit freely available to consumers. Similarly in Europe, once the current Greek debt drama settles down European financials will rebound sharply.

Ms.Lisa mentioned the following four global banks as attractive: HSBC(HBC), JPMC(JPM), Capital One(COF) and Wells Fargo(WFC). These banks have payout ratios of 65%, 65%, 80% and 35% dividend with estimated 37.5% stock buyback respectively. It should be noted that Capital One is primarily a credit card issuer and not a bank.

Since there are hundreds of publicly-traded banks in the US, investors can also other opportunities outside of the major banks. The following is a list of ten regional and community banks for further research:

1.Company: SunTrust Banks, Inc. (STI)
Current Dividend Yield: 2.19%

2.Company: Citizens Financial Group, Inc. (CFG)
Current Dividend Yield: 1.49%

3.Company:Webster Financial Corp. (WBS)
Current Dividend Yield: 2.32%

4.Company: Bank of the Ozarks, Inc. (OZRK)
Current Dividend Yield: 1.18%

5.Company: Glacier Bancorp, Inc. (GBCI)

Current Dividend Yield: 2.48%

6.Company: U.S. Bancorp (USB)

Current Dividend Yield: 2.35%

7.Company: Cullen/Frost Bankers, Inc. (CFR)
Current Dividend Yield: 2.70%

8.Company: Bank of Hawaii Corporation (BOH)
Current Dividend Yield: 2.71%

9.Company: Commerce Bancshares, Inc. (CBSH)
Current Dividend Yield:  1.93%

10.Company: Mercantile Bank Corp. (MBWM)
Current Dividend Yield: 2.63%

Note: Dividend yields noted above are as of June 30, 2015. Data is known to be accurate from sources used.Please use your own due  diligence before making any investment decisions.

Related ETF:

  • SPDR S&P Bank ETF (KBE)

Disclosure: Long GBCI and USB

Related:

The Top 10 Coal Producers in the US

In an earlier post, I noted that coal is the major source of electricity generation in the U.S. In this post, let us take a look at the major coal producers in the country.

Before we get to the list, here are a few points on the US coal industry:

  • The US holds the world’s largest coal reserves. Over one-quarter of the world’s total are in the country with the recoverable reserves estimated to be at 233 giga tons at the end of 2013.
  • The reserves are enough to last for the next 200 years at the current consumption rate.
  • Just five states—Wyoming, West Virginia, Kentucky, Pennsylvania, and Illinois—account for 70% of total US production, with Wyoming alone accounting for 40%.
  • Most of the coal used in the U.S. since the start of the 19th century were mined in the Appalachian region. However today most the coal mining has moved to the Western region where production costs are lower.
  • Appalachia’s major coal producing states are West Virginia, Kentucky, and Pennsylvania.

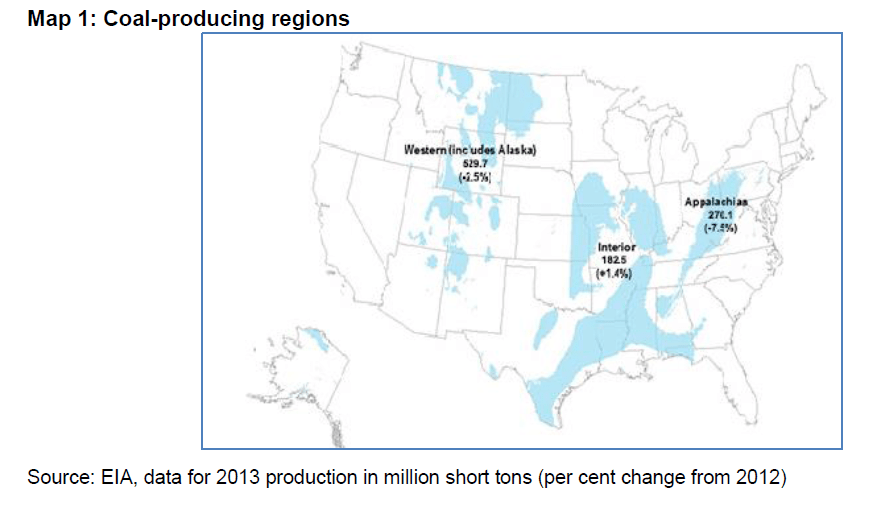
The coal-producing regions in the US are shown in the below map:

Click to enlarge

US Coal Producing Regions

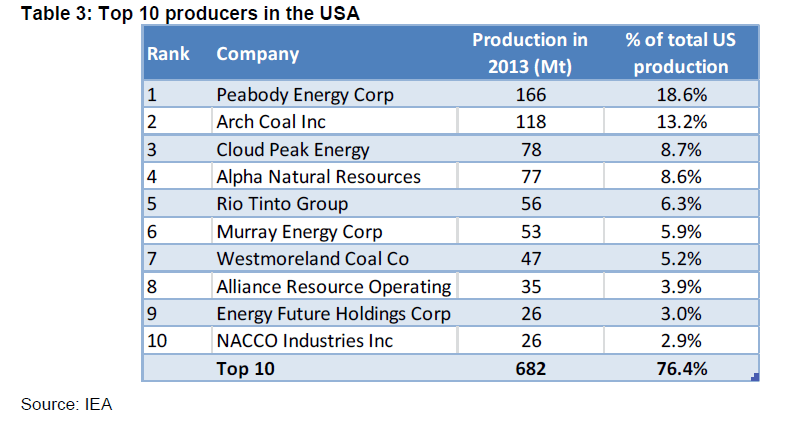
 The Top 10 Coal Producers in the US are shown below:

Click to enlarge

Top 10 US Coal Producers

Source: US Coal Exports:The Long Road to Asian Markets, The Oxford Institute for Energy Studies, University of Oxford

From The Oxford Institute for Energy Studies report:

Coal production is highly concentrated in the USA. The top 10 producers account for three-quarters of total production and half comes from just four producers: Peabody Energy, Arch Coal, Cloud Peak Energy, and Alpha Natural Resources. In order to remain profitable in a low-price market, US producers focus on cost reductions. This includes mine idling, the sale of non- core assets and mine closures. Subsequently, the number of US mines has been reduced drastically, from over 1,400 in 2010 to 1,229 in 2012 and 1,061 in 2013.

Recent years have seen 26 US coal companies go into bankruptcy (chiefly in Kentucky and West Virginia), including once major producers such as James River Coal and Patriot Coal Corporation. In line with decreasing production, US coal mining jobs dropped by 9,400 in 2013, representing more than 10 per cent of total coal employment, from 89,800 in 2012 to 80,400 in 2013. Coal company revenues and stock prices plummeted in 2014, forcing mining companies to further cut operations, especially in Appalachia where expenses are higher, and to lay off roughly 6 per cent of their employees during the first half of the year.

Investment options:

Peabody Energy Corporation (BTUUQ) is the largest coal producer in terms of market capitalization. Some of the other firms from the above list include: Arch Coal Inc. (ARCH), Cloud Peak Energy Inc. (CLD) and Alpha Natural Resources, Inc. (ANR).

Also checkout: The Complete List of Coal Stocks on the NYSE

Disclosure: No Positions