S&P 500 Companies’ Sales By Country

Last year I wrote an article on why investing in U.S. multinationals is not the same as investing in foreign companies. From that article:

Michelle Gibley of Charles Schwab discussed the reasons for investing in foreign firms instead of U.S. multinationals in an article back in May. From the article titled “4 Mistakes to Avoid in International Investing“:

  • “The stocks of U.S. multinational companies tend to move in tandem with other U.S. stocks, and U.S. multinationals typically still derive a large percentage of their profits from the United States. But this misses the point of investing internationally—to diversify into areas that aren’t so highly correlated with the U.S. market.
  • Similarly, multinationals have a greater tendency to hedge currency exposure—and one reason to invest internationally is to increase your currency diversification, not reduce it.
  • U.S. multinationals may not do as well as local competitors in their target foreign markets due to cultural and local differences. After all, not everyone prefers U.S. brands, and some U.S. companies have difficulty customizing products for foreign markets.
  • The U.S. share of the global stock market is declining, so investing in U.S. multinationals means missing out on different opportunities elsewhere. When you look at global GDP, non-U.S. countries dominate, indicating the market share of these countries has room to grow.
  • Owning large multinational companies means excluding small cap companies that are more closely tied to the economic conditions in their local markets. International small cap stocks have even lower correlations to U.S stocks than large cap international stocks.”

Source: 4 Mistakes to Avoid in International Investing, Charles Schwab

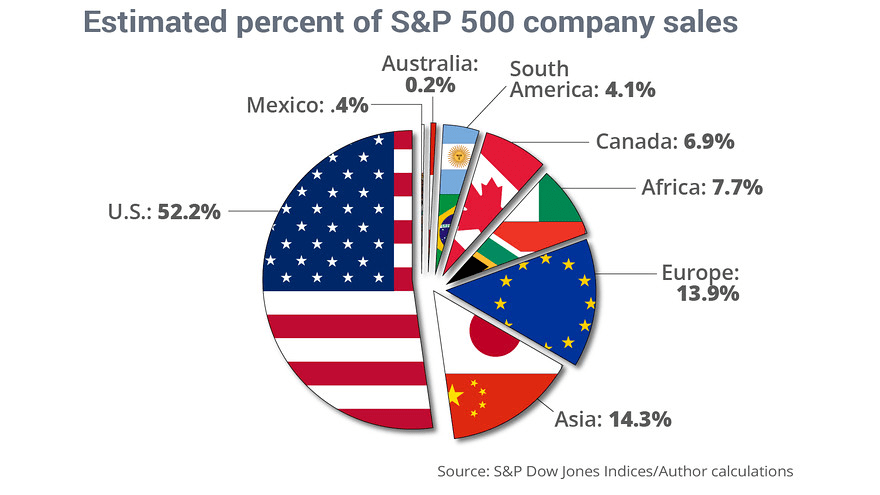
In this post let us take a look at a chart I recently came across at The Big Picture related to this subject. Here is the chart:

Click to enlarge
sp-500-sales-by-coumtry

Source: MarketWatch via Barry

Investors must note that the above chart is not accurate in terms of data and is based on estimates. This is because many US firms including multinationals in the S&P 500 do not report sales by country and may group countries into regions as they wish. For example, instead of reporting sales by US, Canada and Mexico, they may just report it as sales in North America. Similarly they may combine sales in China with the figures for countries such as Taiwan, Hong Kong, etc. and call it ‘The Greater China’ region. 

Knowledge is Power: Paternoster, Tsar Bomba, Market Corrections Edition

Tsar Bomba

Tsar Bomba, The World’s MOST Powerful Nuclear Bomb

Tsar Bomba Updates:

On the Importance of Dividends to Total Returns

Dividend stocks offer cushion to a portfolio during volatile market conditions such as the one we are seeing now while helping to grow the portfolio steadily when markets are strong. Investing in stocks that pay no dividends is highly risky since one is betting on pure price appreciation which may or may not happen. Studies have shown over and over again that dividend payers handily beat non-payers over time. Here is a chart that shows the importance of dividends to total returns based on the S&P 500:

Click to enlarge

Dividends to total returns

Source: Case for dividend stocks now, Fidelity, 8/12/15

Winners And Losers Of Falling Commodity Prices

Lower crude oil prices benefit some countries while others suffer. Similarly cheap oil helps some sectors more strongly than others. For example, airlines and shipping firms benefit heavily as they are direct users of large amounts oil.

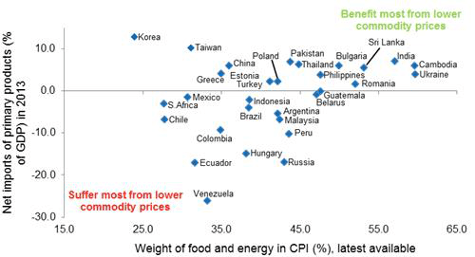
It is not just crude oil that has declined dramatically in the past few months. Other commodities such as palm oil, copper, iron ore, coffee beans, etc. have also plunged by substantial percentage points. The chart below shows the winner of lower commodity prices (not just crude oil): 

Click to enlarge

Winners and losers of lower commodity prices

Source: Nomura Global Markets Research, October 2014 via Emerging market exodus by Maike Currie in Money Observer, Aug 20, 2015

Among the BRICs, Brazil and Russia are losers since both are big exporters of oil, iron ore, agricultural products, natural gas, etc. On the other hand, India and China are winners since both countries are net imports of oil and other commodities. Lower copper prices hurts Chile as the country is the largest exporter of copper in the world.

Lower commodity prices have a net zero impact on Mexico. Though Mexico is a big oil exporter, the Mexican economy also is well diversified with manufacturing and tourism being two other major sectors. So the negative effects of lower oil prices does not adversely impact Mexico than other such as Colombia, Venezuela or Russia.

Review: The Year-to-Date Performance of Chinese ADRs

A few years ago Brazilian equities were the top attraction for global investors when the country was booming. These days the communist country of China has become the focus of attention for investors. Though China is being widely mentioned as the culprit for causing the latest meltdown in world equities, many other factors can be attributed for the crash. For example, though on the surface the US economy seems to have recovered in reality plenty of structural problems continue to persist underneath the surface. Though the official unemployment rate is just 5.3%, the real rate is much worse. By some estimates it is over 20%.

Turning back to China, the Shanghai Composite Index has lost all its gains for the year and is actually down by over 8% now. Many of the Chinese ADRs have performed even worse with losses of over 25%

The following table shows the year-to-date returns of Chinese ADRs trading on the US exchanges:

S.No.CompanyTickerPrice as of Aug 25, 2015Year-To-Date %ChangeIndustry
1Xueda EducationXUE$5.00109.21%General Retailers
2AirmediaAMCN$4.4272.66%Media
3Vimicro InternationalVIMC$10.1669.62%Tech.Hardware&Equip.
4Kingtone Wirelessinfo SolutionKONE$4.0564.63%Software&ComputerSvc
5Bona FilmBONA$11.5262.71%Media
6CTrip.com InternationalCTRP$63.7040.00%Travel & Leisure
7China Nepstar Chain DrugstoreNPD$2.1737.34%Food &Drug Retailers
8China Southern AirlinesZNH$31.6032.22%Travel & Leisure
9RenrenRENN$3.2830.68%General Retailers
10AgriaGRO$1.5628.93%Food Producers
11Perfect WorldPWRD$20.1727.98%Leisure Goods
12WuXi PharmatechWX$42.3325.72%Pharma. & Biotech.
13Jiayuan.comDATE$5.7621.26%Software&ComputerSvc
14KongZhongKZ$6.4919.96%Mobile Telecom.
15Shanda GamesGAME$6.5214.79%Leisure Goods
16NetEaseNTES$112.5213.50%Software&ComputerSvc
1721VianetVNET$17.2811.70%Software&ComputerSvc
18eHi Car Services LtdEHIC$9.0410.78%Automobiles & Parts
19Sinopec Shanghai PetrochemicalSHI$32.4610.67%Chemicals
20China SunergyCSUN$1.3510.66%Alternative Energy
21QunarQUNR$31.219.78%Travel & Leisure
22CNInsureCISG$7.269.50%Nonlife Insurance
23TAL EducationXRS$30.608.94%General Retailers
24JD.comJD$25.068.30%General Retailers
25Tuniu CorpTOUR$12.957.92%Travel & Leisure
26China Eastern AirlinesCEA$26.167.92%Travel & Leisure
27Cheetah MobileCMCM$16.237.34%Software&ComputerSvc
2858.comWUBA$44.336.69%Software&ComputerSvc
29XunleiXNET$7.604.11%Software&ComputerSvc
30MOMO IncMOMO$12.423.50%Software&ComputerSvc
31Xinyuan Real EstateXIN$2.422.54%Real Estate Inv&Serv
32Hanwha Q CellsHQCL$11.010.09%Alternative Energy
33China MobileCHL$58.82UNCHMobile Telecom.
34New Oriental Education & TechnologyEDU$20.36-0.24%General Retailers
35iKang Healthcare GroupKANG$14.90-0.93%HealthCareEquip.&Ser
36China UnicomCHU$13.26-1.41%Mobile Telecom.
37Noah HoldingsNOAH$20.01-4.26%Financial Services
38VipshopVIPS$18.41-5.78%General Retailers
39Sungy MobileGOMO$4.67-6.41%Mobile Telecom.
40China TelecomCHA$54.87-6.54%Fixed Line Telecom.
41Qihoo 360 TechnologyQIHU$53.30-6.92%Software&ComputerSvc
42Ossen InnovationOSN$0.76-7.32%Indust.Metals&Mining
43China LodgingHTHT$24.18-7.99%Travel & Leisure
44Mindray Medical InternationalMR$24.24-8.18%HealthCareEquip.&Ser
45Trina SolarTSL$8.49-8.32%Alternative Energy
46eLongLONG$16.25-9.47%Travel & Leisure
47Homeinns HotelHMIN$26.93-10.29%Travel & Leisure
48VisionChina MediaVISN$8.72-10.38%Media
49JA SolarJASO$7.28-11.11%Alternative Energy
50Youku.comYOKU$15.79-11.34%Media
51JinkoSolarJKS$17.35-11.97%Alternative Energy
52China Ming Yang Wind PowerMY$1.92-12.33%Alternative Energy
53YY Inc.YY$52.98-15.01%Media
54AutohomeATHM$30.90-15.02%Automobiles & Parts
55Taomee HoldingsTAOM$2.91-15.65%Leisure Goods
56Zhaopin LTDZPIN$12.64-16.73%Software&ComputerSvc
57ReneSolaSOL$1.16-17.73%Alternative Energy
58China Life InsuranceLFC$15.89-18.80%Life Insurance
59Guangshen RailwayGSH$19.57-18.90%Travel & Leisure
60Actions SemiconductorACTS$1.57-19.07%Tech.Hardware&Equip.
61500.comWBAI$14.00-19.31%Leisure Goods
62The9NCTY$1.24-20.00%Software&ComputerSvc
63China Digital TV HoldingSTV$2.42-20.92%Electron.&ElectricEq
64JumeiJMEI$10.74-21.15%General Retailers
65SouFunSFUN$5.82-21.24%Media
66Huaneng Power InternationalHNP$42.63-21.30%Electricity
67China Petroleum & ChemicalSNP$63.70-21.37%Oil & Gas Producers
68China New BorunBORN$1.00-21.88%Beverages
69Country Style Cooking RestaurantCCSC$4.62-21.96%Food &Drug Retailers
70NQ MobileNQ$3.01-23.02%Software&ComputerSvc
71Weibo CorporationWB$10.66-25.14%Software&ComputerSvc
72E-House (China)EJ$5.42-25.14%Real Estate Inv&Serv
73China Xiniya FashionXNY$1.65-25.34%Personal Goods
7451jobJOBS$26.51-26.05%Support Services
75Changyou.comCYOU$20.20-26.17%Software&ComputerSvc
76China National Offshore Oil-CNOOCCEO$99.87-26.26%Oil & Gas Producers
77TarenaTEDU$8.03-27.66%Support Services
78PetroChinaPTR$79.36-28.48%Oil & Gas Producers
79China Techfaith Wireless CommunicationCNTF$0.80-28.57%Tech.Hardware&Equip.
80Sky mobiMOBI$2.72-28.61%Software&ComputerSvc
81Concord Medical ServicesCCM$4.51-29.64%HealthCareEquip.&Ser
82Ku6 MediaKUTV$0.69-31.00%Media
83Aluminum Corporation of ChinaACH$7.81-32.20%Indust.Metals&Mining
84ChinaCacheCCIH$6.20-32.54%Software&ComputerSvc
85China Zenix Auto InternationalZX$0.95-33.57%Automobiles & Parts
86Alibaba Group Holding LimitedBABA$68.57-34.03%General Retailers
87iDreamSky TechnologyDSKY$11.04-35.36%Software&ComputerSvc
88E-Commerce China DangdangDANG$5.79-37.67%General Retailers
89China Distance EducationDL$9.99-39.05%General Retailers
90BaiduBIDU$136.99-39.91%Software&ComputerSvc
91AcornATV$0.96-42.86%General Retailers
92China Finance OnlineJRJC$2.99-43.80%Software&ComputerSvc
93ATAATAI$2.40-44.95%General Retailers
94Yanzhou Coal MiningYZC$4.64-44.96%Mining
95Sky Solar Holdings LtdSKYS$6.79-46.62%Alternative Energy
96Leju HoldingsLEJU$5.20-51.67%Real Estate Inv&Serv
97Phoenix New MediaFENG$3.95-52.47%Media
98Daqo New EnergyDQ$11.58-56.04%Chemicals
99LightInTheBoxLITB$2.73-56.60%General Retailers
100Zuoan FashionZA$1.41-57.01%Personal Goods
101BitautoBITA$26.54-62.31%Media
102Yingli Green EnergyYGE$0.83-64.68%Alternative Energy
103Wowo LtdWOWO$5.82-43.00%Leisure Goods
104BaozunBZUN$4.66-53.40%Software&ComputerSvc
105Jupai HoldingsJP$8.70n/aFinancial Services

The complete list of Chinese ADRs including the ones trading on the OTC markets can be found here.

Disclosure: No Positions