Gold prices have declined consistently in the past few years while stocks have soared. At the height of the global financial crisis, experts predicted gold could reach $2,000 easy and even go higher and higher forever. It did not turn out that way. When stocks collapsed investors poured money into gold especially the highly popular SPDR Gold Shares ETF(GLD). At its peak, the fund had over $80 billion in assets. Since then investors have pulled out billions and currently the fund has about $22 billion in assets.
Click to enlarge
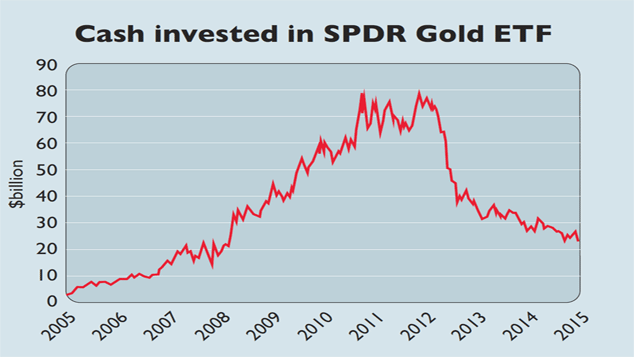
Source: Chart of the week: gold loses its lustre, MoneyWeek
Currently gold is trading at about $1,053 an ounce.
The key point to remember is investing in gold is not a bulletproof strategy. Just like any other asset gold prices can go up as well as go down. Hence just because stocks crash does not mean investors should dump all their assets into gold and vice versa.