Every year Platts, a unit of McGraw Hill Financial published the world’s top 250 energy company rankings. This list can be important source for investors looking to invest in the energy space which includes oil, natural gas electric and gas utilities. With the current turmoil in the oil industry some investors may be interested in top oil companies in order to pick up stocks at the current lower prices.
The rankings are based on a “special Platts formula”. The Platts Top 250 Global Energy Companies list for 2015 are shown below:
Click to enlarge
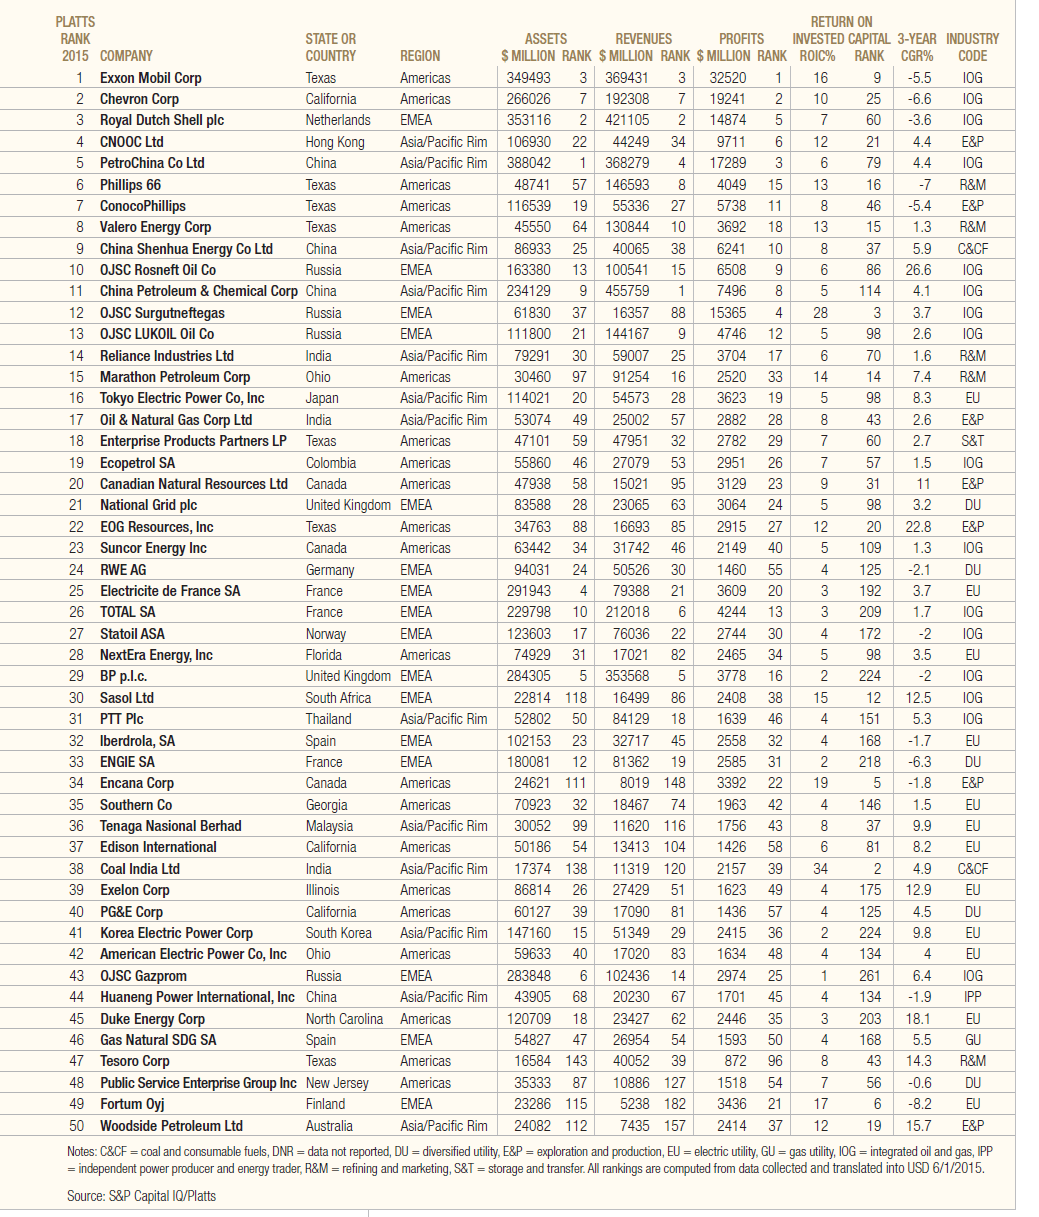
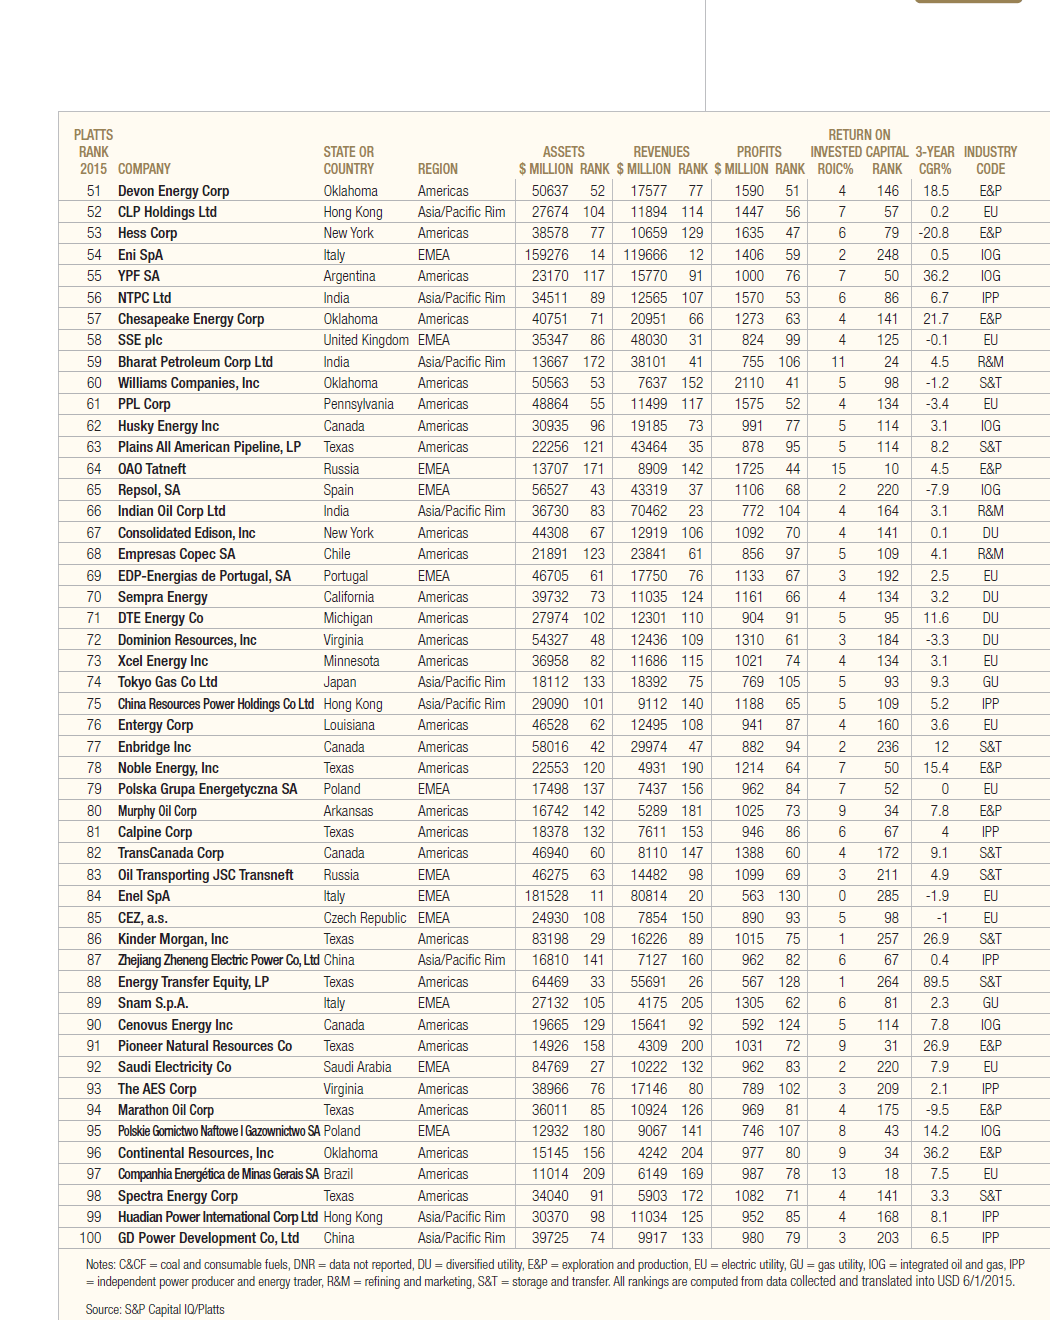
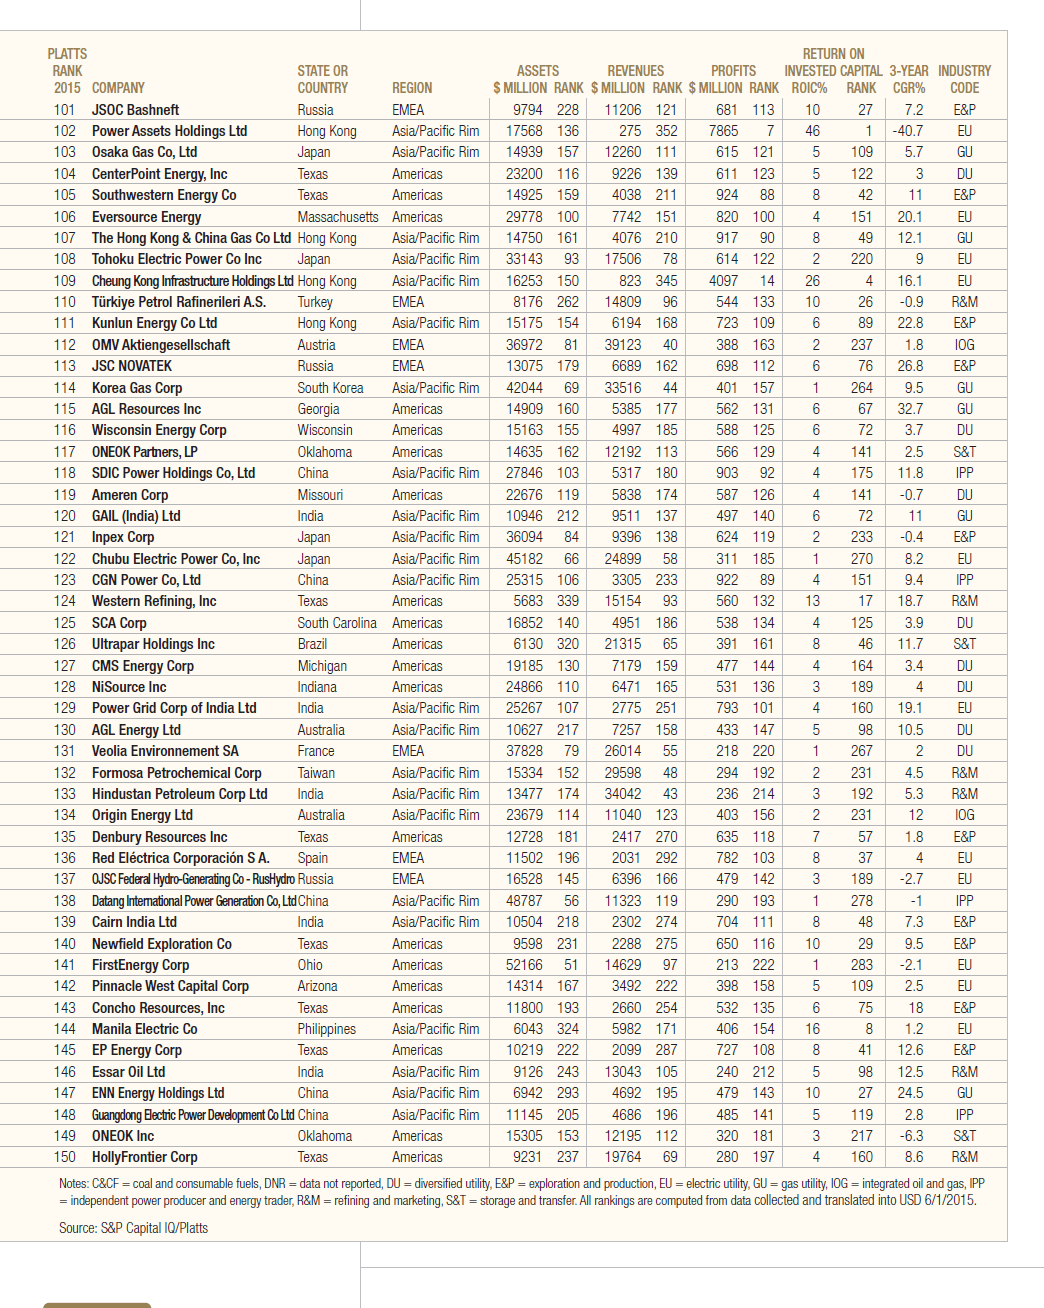
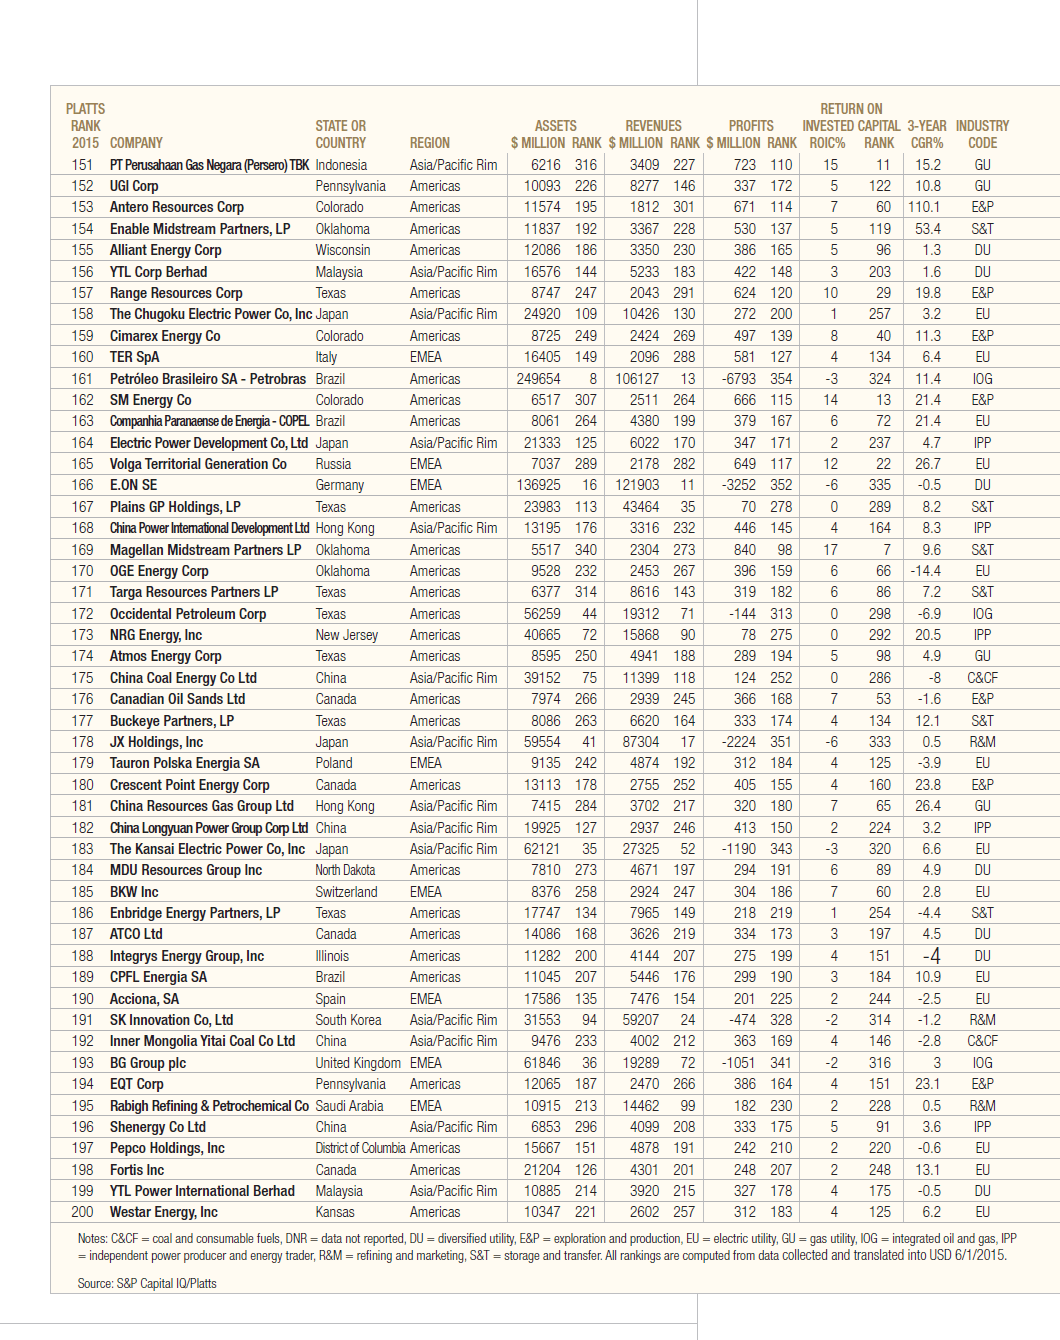
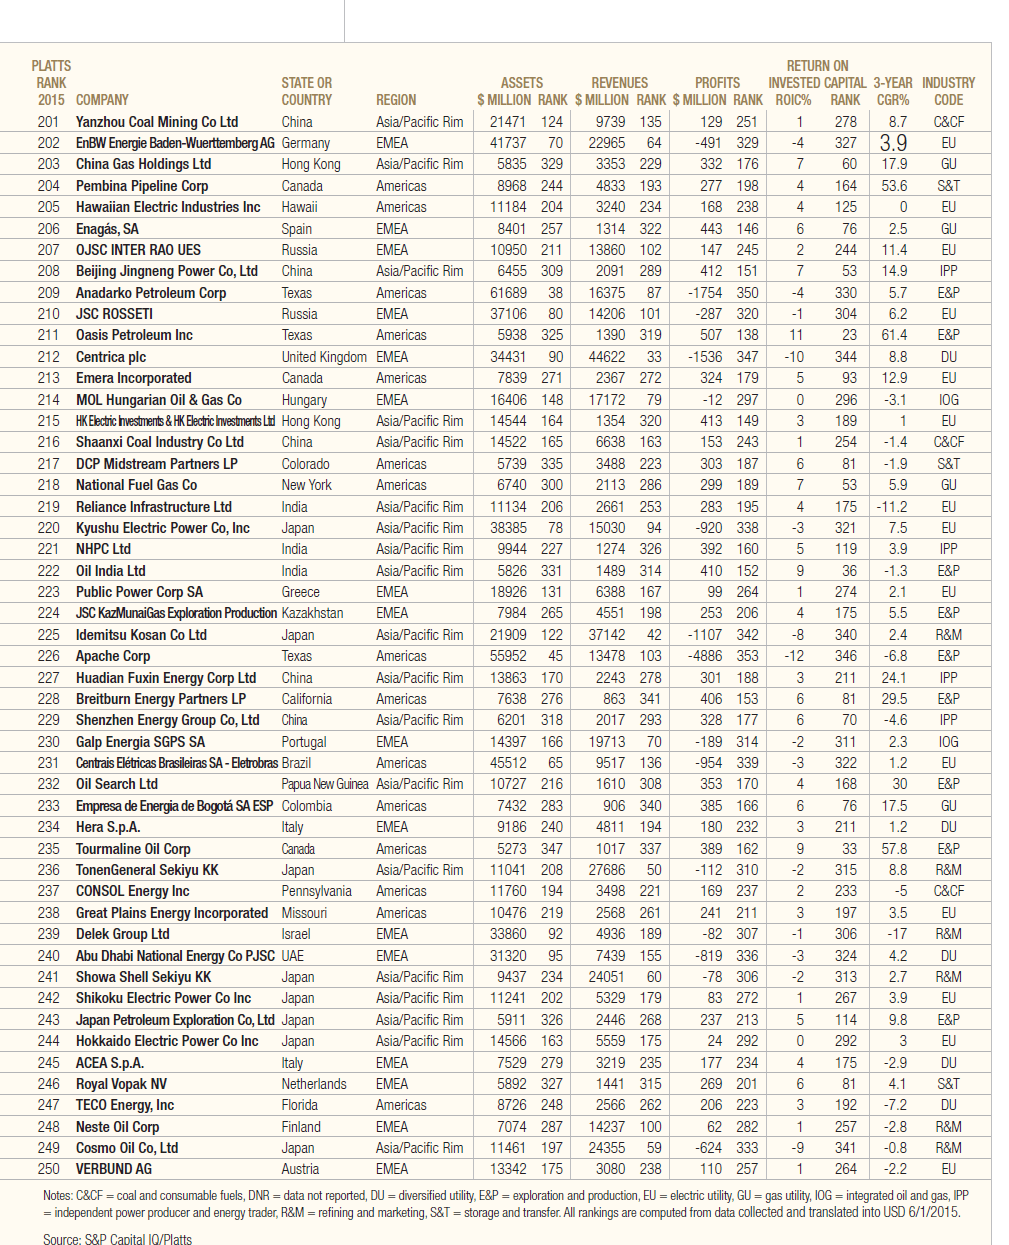
Source: Platts
A few observations:
- Despite the fall in oil prices and the subsequent share prices of firms in the oil sector, major oil companies are some of the top dividend payers in the world. For example, Royal Dutch Shell (RDS-A, RDS-B) was the biggest dividend paying company in the world according to Henderson Global Dividend Index. The next payer in that list was Exxon Mobil (XOM). Billions of dollars of paid out in dividends oil firms each year and income investors are rewarded for their trust and loyalty. If a retired person owns 1000 shares of Exxon Mobil stock, they will receive a solid income each quarter.
- Due to the regulatory mess and other issues investors can avoid European utilities except British utilities. For US investors looking to add utility stocks, plenty of options are available in the domestic utility industry.
- Investors can stay away from pure players in the oil and gas industry. This will be companies that operate in one field such as oil pipelines, storage, refining, etc. Instead going with diversified players is a wise strategy.
- It is important to avoid smaller companies and those that are highly leveraged. Unlike the big oil firms, small companies may not be withstand the current volatility and may go bankrupt wiping out common shareholders.
Download: The Platts Top 250 Global Energy Companies list for 2015 (in pdf)
Disclosure: No Positions