This Stock Market Is Down 99.74% Since 2006

Stocks are a risky asset class.Investing in stocks is not suitable for all and it is possible to lose one’s investment easily.

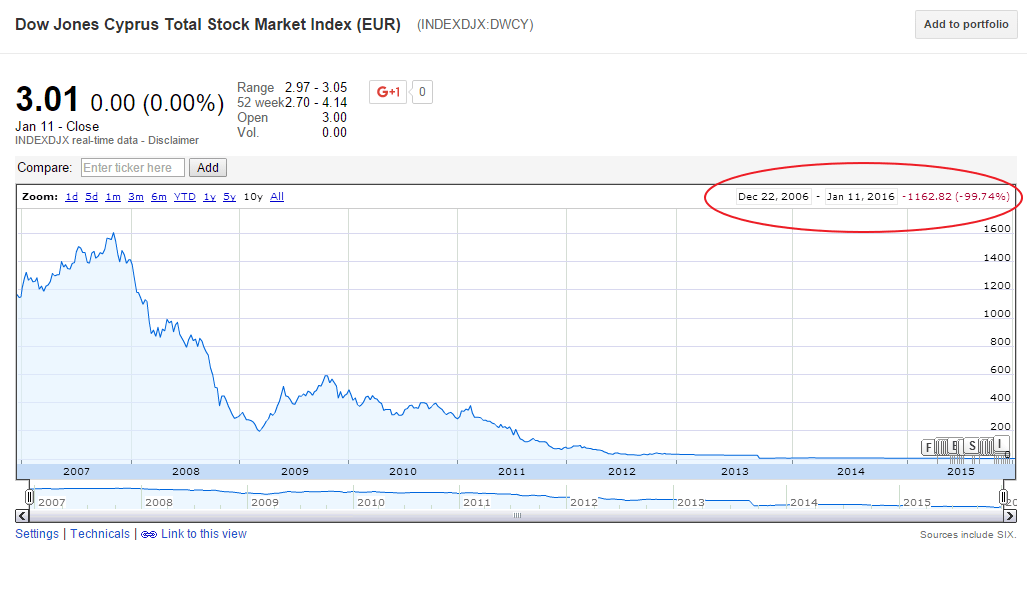
The volatility in global equity markets has shaken some investors. However the current fall is nothing compared to performance of some markets. For example, the Cyprus stock market is down by an astonishing 99.74% since Oct 2006 as shown in the chart below:

Click to enlarge

Cyprus Stock market Returns

Source: Google Finance

In late 2007 the Dow Jones Cyprus Total Stock Market Index made a high of 1,630. From that peak it reached a new low of 2.75 late last year for a decline of 99.986%.

Hence a €10,000 investment in 2007 would now be worth just €1.40, according to one news report. That is indeed shocking !!.

Cyprus is one of the very few countries in the world that forced two bail-ins on its citizens to rescue its crumbling banks.No wonder the equity market practically went to zero.

The key takeaway here is that stocks can plunge as low as possible including and upto 0%.So as long as one does not use margins, the loss will be limited to the invested amount.
10 Stocks To Watch As The Market Volatility Continues

Equity markets worldwide have had a bad start this year with the S&P 500 down so far about 6% just in one week. Other developed and emerging markets as well are in the red.

As this China-induced selloff continues here are some thoughts:

China triggered a global selloff last summer also.And then markets recovered as China intervened with new rules to prevent a total collapse. it remains to be seen if China can cause the global economy to enter into a recession or even a depression.

Unlike other emerging countries, the majority of Chinese equities are NOT held by foreign investors or institutions. Instead the domestic retail investor hold most of the stocks. According to one estimate, just 2% of the Chinese stocks are owned by foreign investors.

Domestic retail investors are prone to follow the herd mentality and are likely to cause volatility of extreme proportions. For example, lack of maturity and long-term thinking drives individual investors to panic when they the markets is a sea of blood red and others sell.

Though countries dependent on China and oil-exporting countries are adversely impacted due to the current situation, it does not mean there no opportunities to be found anywhere. For example, many developed world companies are not highly tied to China or rely on the price of crude oil.

There are always stocks worth buying regardless of the market conditions. Even if the market has entered a bear market, it is impossible for an ordinary investors to wait for the perfect time to pick a stock at the trough. Simply put identifying a bottom is almost impossible.

So despite the current decline in stock prices, there are stocks worth buying at current or lower prices. Wise investors usually take advantage of volatile markets as bargains can be found easily.

Investors with a long-term view can monitor the following foreign stocks for potential additions to their portfolios in a phased manner;

  1. Continental AG (CTTAY)
  2. Novo Nordisk A/S (NVO)
  3. Safran SA (SAFRY)
  4. Nordea Bank AB (NRBAY)
  5. Fresenius Medical Care AG & Co (FMS)
  6. DBS Group Holdings Ltd(DBSDY)
  7. Reckitt Benckiser Group plc (RBGLY)
  8. AstraZeneca PLC (AZN)
  9. Fomento Economico Mexicano SAB de CV (FMX)
  10. Edp Energias De Portugal SA (EDPFY)

Disclosure: Long RBGLY

Review: The Callan Periodic Table of Investment Returns 2015

UPDATE: The Callan Periodic Table of Investment Returns 2016: A Review  ***(New)

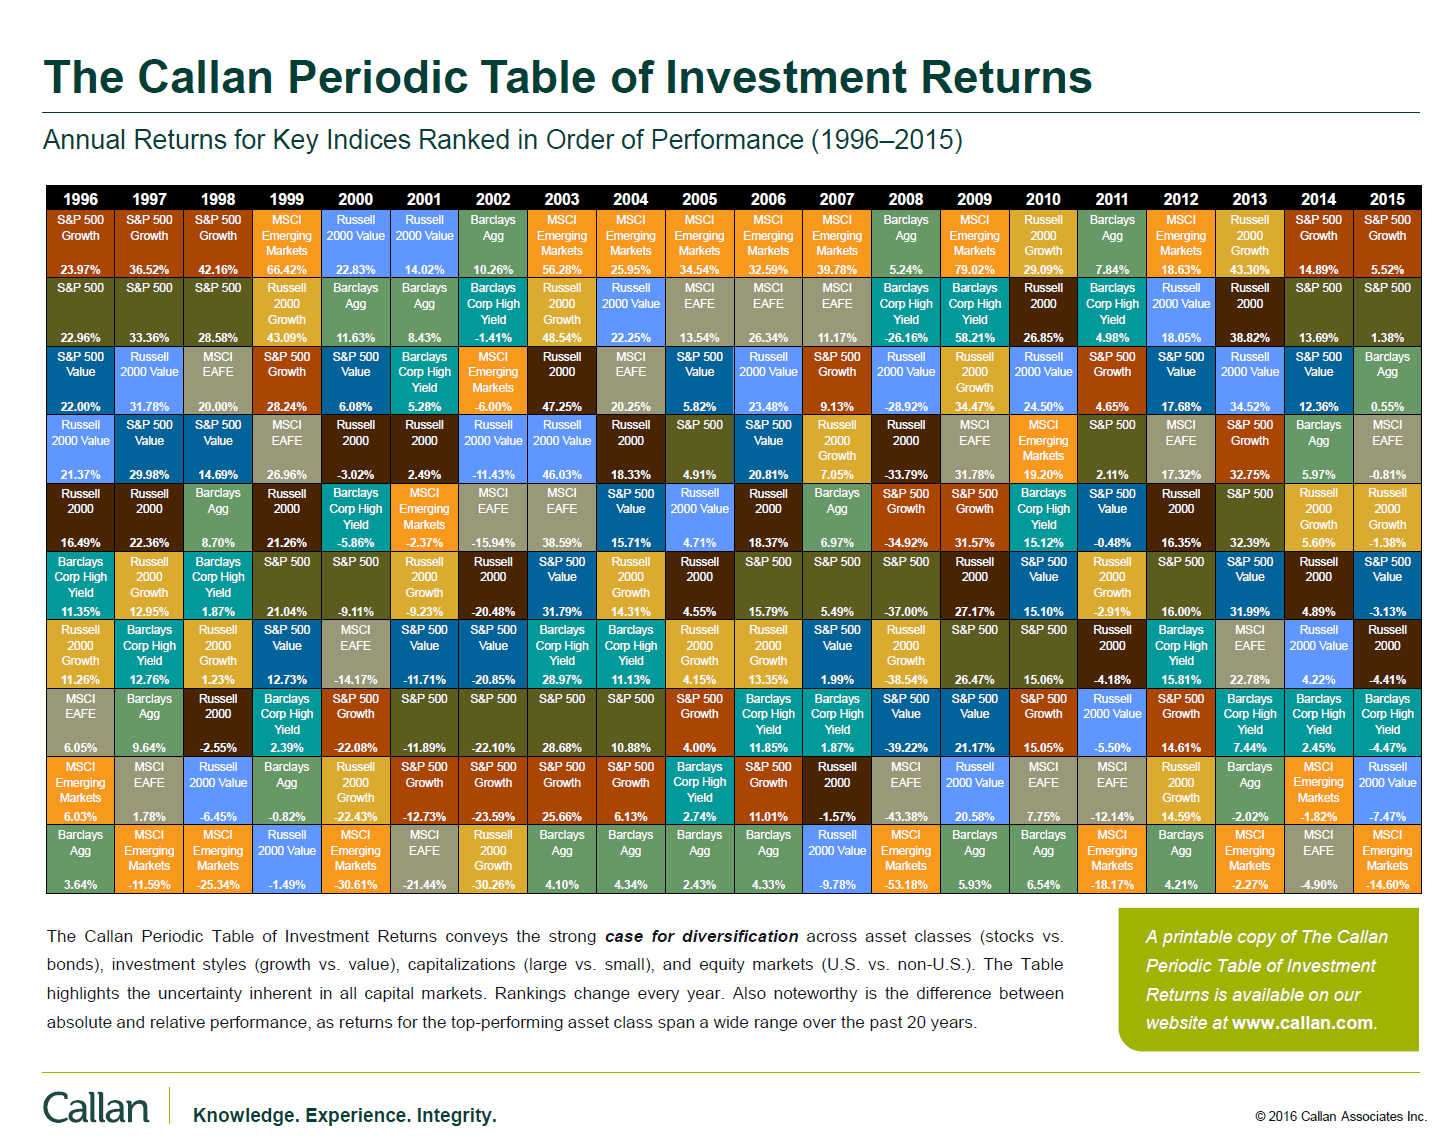
Callan Associates recently published their famous Periodic Table of Investment Returns for 2015. This chart shows the importance of diversification.

The Callan Periodic Table of Investment Returns for 2015 is shown below:

Click to enlarge

Callan Periodic Table of Investment Returns 2015

Source: Callan Associates

For example, the S&P 500 total return last year was 1.38%. On a price return basis it was actually negative at -0.73%. When dividends are included the negative returns turns positive. This is an important point to remember since most media outlets report the price return and not the total return.

Emerging markets has another disastrous year with the MSCI Emerging Markets Index losing over 14%. For the third year in a row, emerging stocks have had negative returns.

Download: The Callan Periodic Table of Investment Returns 2015 (in pdf)

Related ETFs:

  • iShares Dow Jones Select Dividend ETF (DVY)
  • SPDR S&P Dividend ETF (SDY)
  • Vanguard Dividend Appreciation ETF (VIG)
  • SPDR S&P 400 Mid Cap Growth ETF (MDYG)
  • iShares Russell Midcap Index Fund (IWR)
  • iShares MSCI Emerging Markets Indx (EEM)
  • SPDR S&P 500 ETF (SPY)
  • SPDR STOXX Europe 50 ETF (FEU)

Disclosure: No Positions

Related: The Callan Periodic Table of Investment Returns 2016: A Review

Knowledge is Power: China Conundrum, Laying Brics, Market Volatility Edition

Zoo Animal

A Meerkat

The Big Mac Index vs. The Little Mac Index

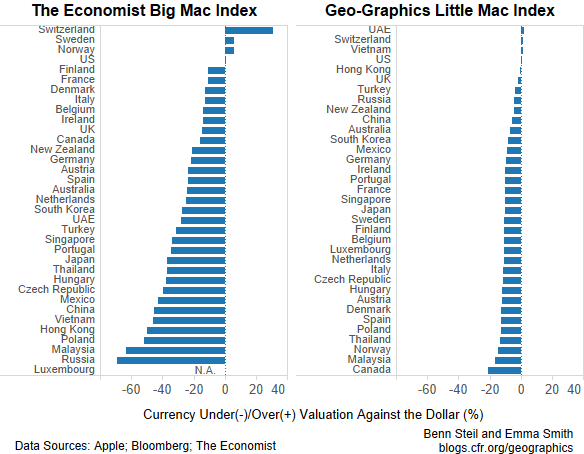
Price comparison of the same product across countries is an interesting analysis to see how products are cheaper or costly in various countries. The Economist’s famous Big Mac Index uses the Big Mac burger of McDonald’s for this comparison. CFR tried a different approach using Apple’s iPad minis. Their research shows that the average price differential between countries based on the iPad is only 9% which is not as huge as the one using the Big Mac.

Click to enlarge

Little Mac vs Big Mac Comparison

Source: Our Little Mac Index Flame-Broils The Economist—Yet Again, CFR

From the article:

The Economist magazine’s famous Big Mac Index uses the price of McDonald’s Big Macs around the world, expressed in a common currency (U.S. dollars), to estimate the extent to which various currencies are over- or under-valued. The Big Mac is a global product, identical across borders, which makes it an interesting one for this purpose.

But burgers travel badly.  So in 2013 we created our own index—one that better meets the condition that the product can flow quickly and cheaply across borders.

The Geo-Graphics Little Mac Index compares the price of iPad minis across countries. iPad minis are a global product that, unlike Big Macs, do in fact travel the earth with their owners.

As can readily be seen in the graphic above, our Little Mac Index shows that the law of one price holds far better than the Big Mac Index – as it has done consistently over the past several years. In January, the average overvaluation of the dollar according to the Big Mac Index was 26 percent – a Whopper.  According to our Little Mac Index, the average overvaluation was only 9 percent – Small Fries.  This suggests it’s time to deep-fry their index and move over to ours.

Though this CFR comparison is interesting, the one flaw is that unlike iPad minis the Big Mac burger is an everyday product that is easily available and may be affordable to most people in countries around the world. Apple’s(AAPL) products are exorbitantly expensive in emerging countries and unlike developed countries, Apple does not have a cult-like followers in those countries. So The Economist’s example is a better comparison than the CFR’s Little Mac.

Disclosure: No Positions

Related: