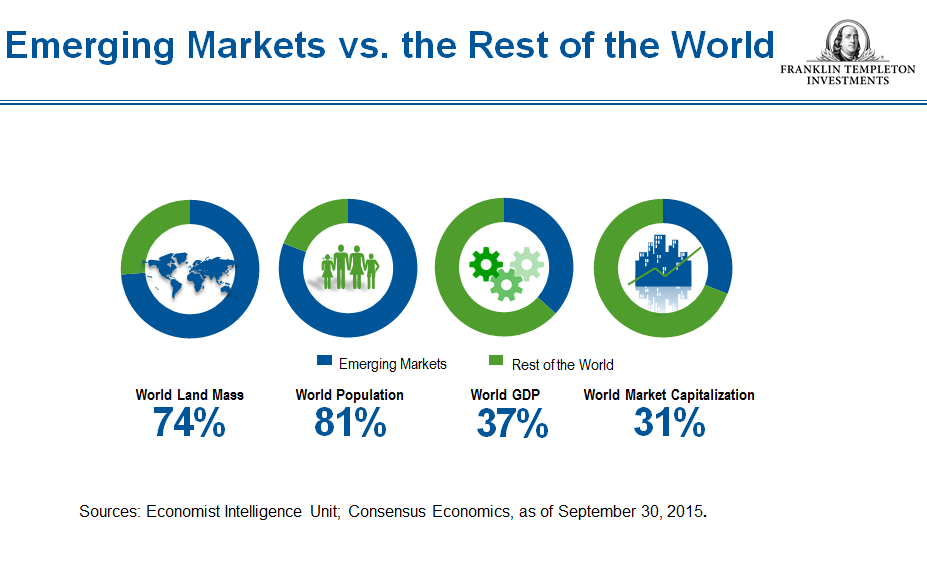
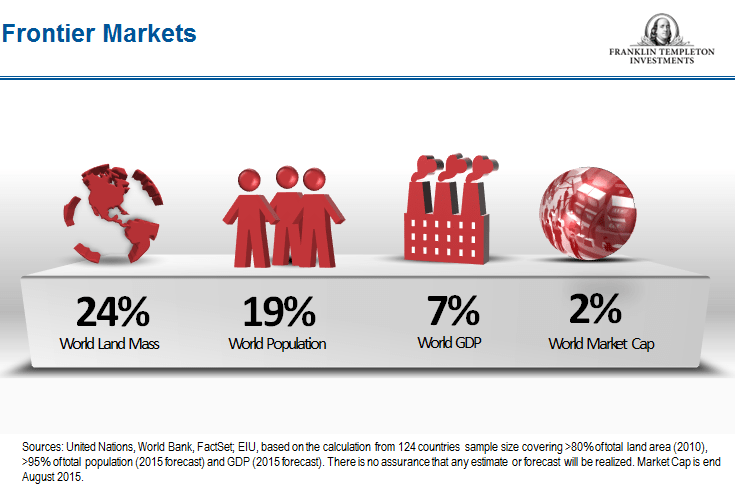
Dividend Withholding Tax Rates By Country 2016

*** UPDATE:  For the latest Dividend Withholding Tax Rates click : Dividend Withholding Tax Rates By Country 2017

When investing in overseas stocks investors have to pay withholding taxes on dividends paid out by a foreign company. Usually this tax is held by the country when dividends are sent out to non-resident investors. US investors can lose a big chunk of the dividends to this taxes depending on the tax rate imposed by the country of dividend origin. For example, Switzerland has a high withholding tax rate at 35% but a country like Singapore does not deduct any taxes at all for dividends paid to foreign investors by Singapore-based firms.

Just like other taxes, the dividend withholding tax rates also change sometime every year. So here is a simple and easy table that shows the Dividend Withholding Tax Rates By Country for 2016:

NOTE: These rates are standard rates and do not include lower rates which may be available due to tax treaties between countries or other reasons. For example, one can get lower tax rates for Canada by filing special forms with Canada. Details here.

Click to enlarge

Dividend Withholding Tax Rates for 2016

Source:  S&P Dow Jones Indices LLC

*** UPDATE:  For the latest Dividend Withholding Tax Rates click : Dividend Withholding Tax Rates By Country 2017

Another source: Dividend Withholding Tax Table for 2016, NYSE

Related:

Duration of Bull and Bear Markets in Indian Stock Market

S&P BSE Sensex Index, the benchmark of India’s equity market is down 4.5% year-to-date. Though the index closed at 24, 952 on Friday,  in February it went below 23,000. During February, the Sensex was in a bear market having fallen over 23% from the previous peak reached in March 2015. Last month the index fell over 800 points one day. In general, the equity market in India is volatile just like other emerging and frontier markets. Indian equities tend to move strongly upward within a short period only to crash violently quickly as well. Since Indian equities are volatile it is wise to learn about past performance of the market. The Indian market has experienced strong bull and markets over the years since 1990.

The following chart shows the bull and bear market durations of the Sensex:

Click to enlarge

Sensex Bull and Bear Markets

Source: Is the market caught in an 8-year bear cycle?, The Hindu BusinessLine, Feb 12, 2016

Some fascinating facts about the Indian equity market are listed below:

  • Every eighth year the Sensex has declined by more than 50%.
  • In 1992, the index fell by 56%.
  • When the dot-com bubble popped the Sensex fell by 58%.
  • During the global financial crisis of 2008, it crashed by an astonishing 62%.
  • Similar to other markets worldwide, the Sensex recovered sharply after the 2008 crisis. The bear market at that time lasted just 13 months.
  • Bull markets are also characterized by swift and violent moves in a short time. For example, between March 2009 and November 2010, the index soared by 162%.

Why are Indian stock so volatile?

  • While there are an infinite number of reasons that can be attributed to the movement of any market including the Indian equity market, here are a few reasons why Indian equity market is volatile:
  • The debt market (bond market) is undeveloped and is very tiny. As a result much of the capital flows into equities driving volatility.
  • Foreign institutional investors are some of the major players in the market. Operating from tax heavens such as the Mauritius such investors plough billions of dollars into the market pull them swiftly out at signs of any trouble.
  • Retail investor participation in India is still very low. By one estimate it is just 3.3%. As a result, major investors such as institutions, mutual funds, wealthy individuals control the direction of the market.
  • Ordinary retail investors are some of the most impatient investors anywhere including India. So when the markets go up they pile up pushing prices higher and higher and run for the hills when markets fall.
  • Though there is a lot of hype and hope among investors about India being the best of the BRICs now, plenty of fundamental structural issues remain in the Indian economy.
  • Indian companies, including large-caps, traditionally have low dividend yields. The dividend yield has been less than 1.50% for many decades. Due to the low payouts, investors buy stocks hoping for price appreciation rather than yields. So during bull markets investors go rush into stocks driving prices ever higher while during bear markets the low yields on stocks offer not much help to hold on to them or depend on them for a steady stream of income.

Updates (10/1/17):

Bull and Bear Markets in India Chart:

PE Expansion During Bull Markets in India Chart:

Earnings and PE Contribution in Bull Markets in India:

Source: What the past 6 bull runs tell us about this market, Live Mint

Bull and Bear Market Duration:

Source: Dalal Street

Related ETFs:

  • WisdomTree India Earnings ETF (EPI)
  • iShares S&P India Nifty 50 Index  ETF (INDY)
  • PowerShares India ETF (PIN)

Disclosure: No Positions

Related articles: 

Also see: 


What is the Impact of Quantitative Easing on Savers?

Quantitative Easing (QE) programs have been implemented by central banks of many developed countries since the Global Finance Crisis(GFC) of 2008-2009. In simple terms, the programs eases the short-term interest rate to zero or close to zero. In the US, this rate known as the Fed Funds Rate, has remained at or near zero since the programs started. This is the rate that the Fed lends funds to banks.

Since central banks have been lending money practically for free, interest rates on deposits have fallen to zero or near zero. This has adversely affected savers as they see their savings earn practically nothing year after year.On the other hand, borrowers and investors have done well during the same period. Here is an illustration using the UK as an example:

Click to enlarge

QE Impact on Savers
Source: The effects of seven years of quantitative easing by Laith Khalaf of Hargreaves Lansdown. Money Observer

Since 2009, UK savers have earned a total return of about 5% on their deposit accounts while investors in the equity market have earned 138% with dividends reinvested. Borrowers have benefited too with the average mortgage rate declining by 31%.

In the US, the average interest rate on savings accounts was just 0.56% last week according to Bankrate data. At this rate, a saver with $100,000 in a savings account would earn $560 in interest per year which will be even lower after accounting for taxes. So interest rates this low are crushing savers especially retirees and other vulnerable persons who depend on savings for steady income for expenses. Since cost of living is rising exponentially each year and average wages are declining year after year, ordinary Americans are artificially forced by the state to look for yields in places other than banks. Hence savers funnel their funds into things like the stocks, junk bonds, options, casinos, lotteries, online peer-to-peer lending, flipping houses, etc.

Mark Mobius: Mexico Is a Standout in Latin America

Mobius and his team think that Mexico is a standout in Latin America. Some of the reasons for this uniqueness include the country’s closeness to the U.S. and dependence on the US economy, less reliance on oil revenues, etc.

From a recent blog post by Rodolfo Ramos Cevallos, Templeton Emerging Markets Group:

Over the last two decades, Mexico has taken decisive steps to integrate with the global economy through trade agreements, so it can be affected by external factors such as slowing global growth. While 2015 was a challenging environment for investors—including those in Mexico—we think Mexico stands out from many other countries in Latin America, and as well as other emerging markets, for a number of reasons. Mexico has developed into a high-value-added exporting powerhouse to the United States. It has passed structural reforms geared to encourage competition and attract investments at a time when most countries are shying away from private investment and liberalization, and it has stable fiscal and macroeconomic management. Because of this differentiation, Mexico’s equity market has been able to outperform broader Latin America as well as emerging markets overall (as measured by MSCI indexes) in the last one-, three- and five-year periods.1

Currently, we are seeing opportunities in the export sector, which has benefited from a weakening in the Mexican peso versus the US dollar over the past couple of years. The automotive industry is a good example; Mexico is the seventh-largest automobile manufacturer in the world and largest supplier of automobile parts to the United States.2 Production of light vehicles has been on the rise, expected to grow from 3.2 million units annually in 2014 to more than 5 million units by 2020.3 We are also seeing bargains in the mining sector. While the mining sector has been out of favor in recent years, we have been able to find cost-competitive companies in Mexico with solid balance sheets that appear well-positioned to potentially benefit when the cycle turns.

In recent years, Mexico has performed well when compared with the former emerging markets favorite Brazil. The chart below shows the 5-year wide gap in returns of the country ETFs for these two markets:

Click to enlarge

EWW vs EWZ

Source: Yahoo Finance

On the impact of oil on the Mexican economy he wrote:

While oil is meaningful to the Mexican government in terms of revenues, Mexico’s reliance on oil is considerably less than is commonly believed, as oil represents only about 10% of its exports.5 With the decline in oil prices and an increase in economic activity, oil’s importance in Mexico has been significantly reduced in the last couple of years, with income tax and value-added tax (VAT) picking up the slack. Oil’s contribution to the federal budget has dropped by half in the last couple of years from about 40% in 2008 to about 20% in 2015.6Unfortunately, consumers have generally not seen lower prices at the pump yet, but with the liberalization of the oil sector that could change in the coming years.

Throughout Latin America, governments can no longer rely on high commodity prices to help them finance key programs and projects, particularly related to infrastructure. So I think reforms are going to be very important. Energy reform in Mexico has opened up the oil sector to private investment through different participation schemes. Previously, the state-owned enterprise Pemex was the only firm that was allowed to capitalize on oil resources. Now, the newly established National Hydrocarbons Commission has the authority to auction fields to private parties. The commission has conducted three auctions so far, and each was more successful than the previous one, with the most recent auction securing a 100% assignment rate. The onshore fields already auctioned have low costs and have been profitable even at currently low oil prices. In addition to these auctions, Pemex will be able to partner with specialized oil players to develop its existing resources. The government is currently working on the rules governing the Mexican equivalent of a US master limited partnership (MLP) that will be used to list energy assets from Pemex and private parties. We believe all of these developments will likely lead to an increase in foreign direct investment.

Source: Why We Think Mexico Is a Standout in Latin America by Rodolfo Ramos Cevallos, Templeton Emerging Markets Group

Ways to invest in Mexican stocks:

One way to gain exposure to Mexican equities is via the iShares MSCI Mexico Capped (EWW) ETF. Current the fund has an asset base of over $1.0 billion.

Some of the Mexican ADRs that investors can consider include: Fomento Economico Mexicano SAB de CV (FMX), America Movil (AMOV), Coca-Cola Femsa (KOF), Kimberly Clark de Mexico (KCDMY), Grupo Aeroportuario del Sureste (ASR), Grupo Aeroportuario del Pacifico(PAC), etc. The full list of Mexican ADRs can be found here.

Notes:

1. Source: MCSI. The MSCI Emerging Markets Index captures large- and mid-cap representation across 23 emerging market countries; the MSCI Latin American Index captures large- and mid-cap representation across five emerging market countries in Latin America. The MSCI Mexico Index is designed to measure the performance of the large- and mid-cap segments of the Mexican market. Indexes are unmanaged, and one cannot directly invest in an index. They do not reflect fees, sales or expense charges. Past performance is no guarantee of future results.

2. Source: Mexican Auto Industry Association (Asociación Mexicana de la Industria Automotríz), based on 2014 data.

3. Ibid. There is no assurance that any estimate or forecast will be realized.

4. There is no assurance that any estimate or forecast will be realized.

5. Sources: Energy Information Administration, Bank of Mexico, based on 2014 data.

6. Source: El Economista, March 2016.

7. Based on the Consumer Price Index.

Disclosure: No Positions


The Top Producers of Major Agricultural Commodities

Global food prices are impacted by a multitude of factors. One of the main factors that affect food prices is the price of oil. Rising oil prices tend to raise food prices. When food prices rises, usually it is the poor countries that take the brunt of the negative impacts.

Food prices spiked in 2007–2008 and again in 2010–2011. But recently prices have been declining due to the lower oil prices. Among the agricultural commodities, rise in prices of staple grains such as cor, wheat, rice adversely affect poor countries.

The following chart shows the top producers of major staples such as soy, wheat, rice and maize:

Click to enlarge

Top Producers of Major Commodities

Source: Anticipating and Avoiding Global Food Price Crises, CFR

The US is the top producer of maize and soy while China ranks the highest in the production of rice and wheat.