The International Federation of Robotics (IFR) publishes a report each year on the use of robots in manufacturing in countries around the world. According to the latest date, Korea is the top country for industrial robots use with about 1,000 per 10,000 workers in manufacturing industry. Singapore came in at second followed by Japan and Germany as shown in the chart below:
Click to enlarge
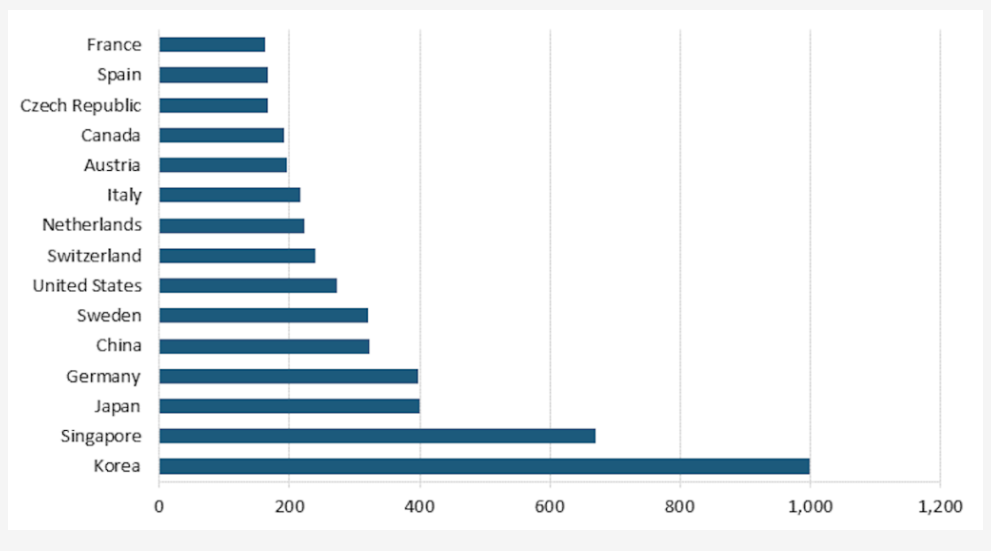
Source: IFR report via China using industrial robots at 12x US rate, Asia Times
China’s usage rate is 322 robots while the US is lower at 274 robots per 10,000 workers.
In terms of robot adoption, Asia leads the world. The US rate is again lower then other peer countries like Germany which is a high-wage country.
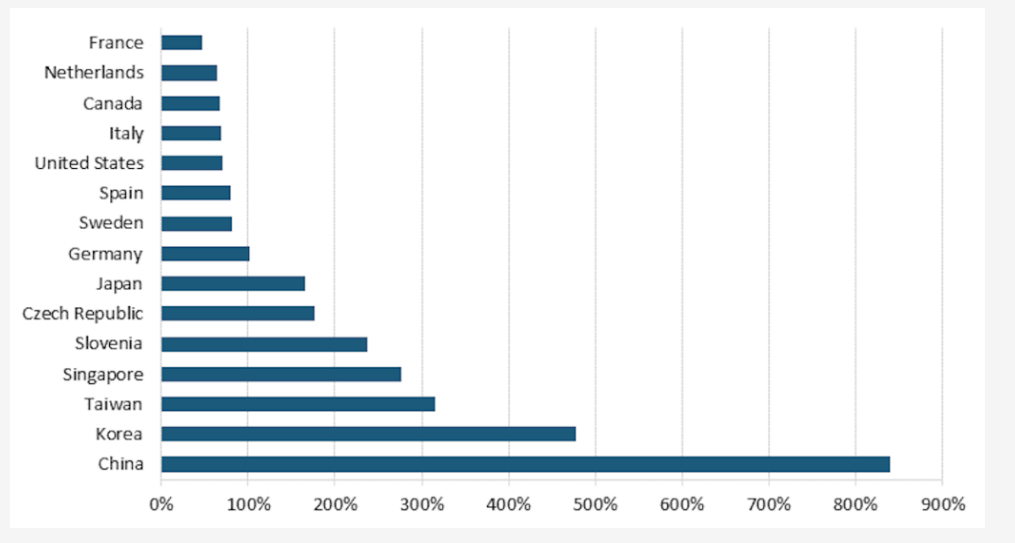
Source: IFR report via China using industrial robots at 12x US rate, Asia Times