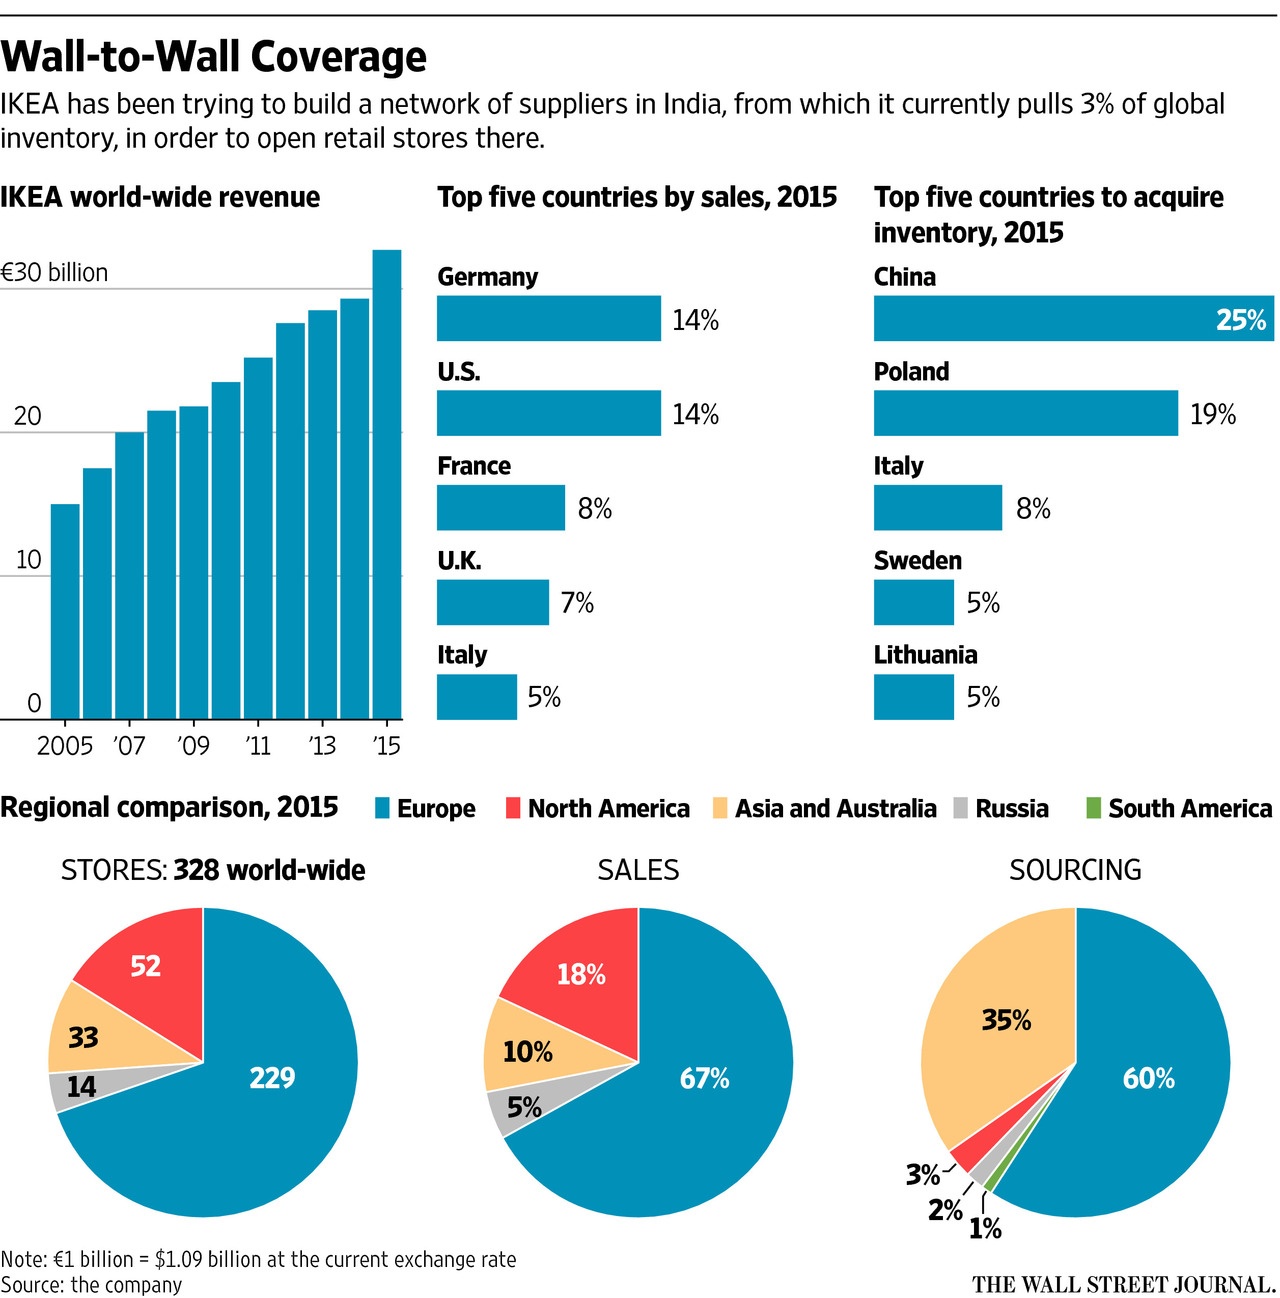
Chart: IKEA – Number of Stores and Top Countries for Sales

Swedish retailer IKEA is the world’s largest furniture chain. Similar to successful global retail chains such as Walmart, Tesco, Carrefour, etc. IKEA has a loyal following in the countries it operates. Here is a neat chart that shows some key facts about IKEA:

Click to enlarge

IKEA Sales and Top Countries Chart


Source: IKEA’s India Bet Runs Into Thicket of Rules, WSJ, Feb 23, 2016

Update:

Related posts:

The Number of IKEA Stores per Capita by Country: Chart

On The Current Valuation of India Stock Market

The Indian equity market is under-performing so far this year. The benchmark S&P Sensex index is down 2% year-to-date compared to S&P 500’s gain of 1.05%. Among emerging markets China is down much higher than India but Brazil is up by about 24% as Brazilian equities are recovering due to clarity on the political crisis there.

From an investment perspective, are Indian stocks cheap or expensive now?

According to an article by Sukumar Rajah at Franklin Templeton Investments, valuations of Indian equities currently are around long-term averages as the chart shows below. The previous peak of 20.9 for the S&P Sensex is unlikely to be reached again unless corporate earnings improve.

Click to enlarge

India Sensex Long-term Valuations Chart

Source: How India Is Stepping Out of China’s Shadow, Sukumar Rajah, Franklin Templeton Investments, April 28, 2016

The easiest way to invest in India is via ETFs as only a handful of companies trade on the US exchanges.

As an emerging market, Indian stocks can be very volatile. So an investor should perform a deep analysis before jumping into any individual equity. ETFs on the other hand offer a safer option since they can contain a basket of securities.

Investors looking for income opportunities should avoid India since dividend culture is yet to be adopted by many firms and Indian firms are not known for sharing their wealth with investors. The current dividend yield on the S&P Sensex is just 1.6%.  Other emerging markets in Asia such as Thailand, Indonesia, etc. offer much higher yields of 3 to 4%. As a developing country one would expect Indian firms to offer higher dividend payouts to investors to attract capital. However that is not the case.

In summary, invest in Indian stocks for mostly capital appreciation.

ETFs: The Complete List of India ETFs and ETNs Trading on the US Markets

On The Relationship Between Chinese Economic Growth And Stock Market Returns

A country’s economic growth as measured by GDP and stock market returns are not positively related to each other. Economic growth figures show what happened with the economy during a period and is a lagging indicator. On the other hand, stock returns are driven by a variety of factors including expectations of future earnings of a company. So in the short-term investors can over-hype certain stocks or sector leading to bubble level valuations. In this case, high stock returns does not have relationship with the underlying economy.

While the disconnect between economic growth and stock returns is high in developed countries, it gets to the extreme in developing countries. This is because emerging countries tend to have high economic growth and stock markets are still in early stages of development. For example, China is expected to grow only 6.5 to 7% this year. This figure is huge compared to developed countries. But for emerging countries like China high single digit GDP growth is considered moderate or low. Though Chinese GDP is projected to have this growth rate, stock markets in China are already down for the year. The Shanghai Composite Index has plunged 17% so far this year. It was down even more earlier in February.

Click to enlarge

China GDP Growth

Source: WSJ

Here is an excerpt from an article by Ken Fisher is founder and chief executive of Fisher Investments:

STOCKS MOVE FIRST

For example, the US economy did fine overall in 1981, growing 2.5 per cent, though a recession started mid-year. Stocks knew it was coming, falling 4.9 per cent for the year. GDP was positive, yet stocks fell!

That recession lasted until November 1982, and GDP shrank 1.9 per cent that year. But stocks started pricing in the coming recovery before the economy improved – gaining 21.6 per cent in 1982. Negative GDP, yet hugely positive stocks!

The same thing happened in 2000, when real US GDP grew 4.1 per cent but stocks peaked and started their first down-leg of a major bear market, signaling the 2001 recession. Similarly, GDP was actually positive in 2008, though flattish, growing 0.4 per cent for the year, while stocks fell a big 37 per cent.

In 2009, stocks turned up in March, but the economy didn’t turn positive until the third quarter. Though growing by year-end, US GDP shrank 2.4 per cent in 2009, while US stocks boomed 26.5 per cent.

The positive third-quarter GDP reading was first released at the end of October. If you waited for that, you missed a 31.5 per cent move in US stocks from the March low. Stocks move first – up or down.

Second problem: even during a growth cycle, stocks can be below average when growth is above average, and vice versa. In 1992, real GDP growth was above average – 3.4 per cent – but stocks returned a fairly lacklustre 7.6 per cent.

Why? Expectations can get out of whack. If growth is above average but below expectations, that can disappoint. If it’s better than expected while still below average, that can boost returns. Surprise moves the market in the intermediate term, for better or worse.

And never forget! Stocks look forward, while GDP measures what just happened and is released at a lag. So while economic growth is an overall market driver, don’t expect it to be a leading indicator.

The US is a huge developed nation. In smaller developed nations, you can get even more disconnect – and more still in emerging markets. China, for instance, has had huge growth in recent years – topping 14.2 per cent in 2007!

And China has had some huge market years, up 87.6 per cent in 2003 and 82.9 per cent in 2006, for instance. But Chinese GDP grew 9.6 per cent in 2008 – when stocks plummeted 50.8 per cent. And Chinese stocks fell huge in 2000, 2001, and 2002, when its economy boomed.

GROWTH IN CHINA

It’s normal for emerging nations to have huge GDP growth. As a nation grows, it has big per capita GDP gains. As more of its citizens move up into an emerging middle class, they start purchasing cars, appliances and luxury goods, which also fuels growth. That in turn requires more infrastructure, which results in greater wealth and more growth.

Chinese GDP and stock market returns
Year China real annual GDP (%) MSCI China returns (%)
2000 8.4 -30.5
2001 8.3 -24.7
2002 9.1 -14
2003 10 87.6
2004 10.1 1.9
2005 11.3 19.8
2006 12.7 82.9
2007 14.2 66.2
2008 9.6 -50.8
2009 9.2 62.6
2010 10.6 4.8
2011 9.5 -18.2
2012 7.7 23.1
2013 7.7 4
2014 7.3 8.3
Source: International Monetary Fund, World Economic Outlook Database, Factset, MSCI China total return in US dollars

Plus, though China remains officially ‘communist’, it has loosened its economy tremendously (relatively). A lot of that growth is years of suppressed ingenuity and productivity hitting its economy all at once. Can it continue? Sure. There’s no inherent reason (other than government meddling) why China has to slow down.

Source: GDP makes stocks grow: Fisher’s financial mythbusters, Ken Fisher, Money Observer

The key takeaway here for investors is that investors should not base on their investment decision in emerging markets based on economic growth alone.

Infographic: Religion and Oil in Middle Eastern Countries

Countries in the Middle East have deep sectarian religious divisions. Many people in the western world are not aware that Saudi Arabia for example is mostly Sunni Islam while most in Iran follow the Shia faith of Islam.These two groups do not get along very well. Hence Saudi Arabia opposes the spread of Iranian influence and vice versa. Iraq used to be run by its late dictator Saddam Hussain who was a Sunni. When he was toppled power was transferred to a group of Shias. So the Sunnis are unhappy with this arrangement and are fighting the state there.

Here is an infographic that shows the religious affiliations and oil wealth by country in the Middle East:

Click to enlarge

Middle East Countries by Religion and Oil


Source: Middle East: Sectarian Divisions and Oil Riches, Sputnik

Update (5/10/16):

Middle East Religious Differences by Country


Source: Saudia Arabia and Iran: The Cold War of Islam, Der Speigel

Avoid Major British Bank Stocks

Many developed European banks have been in a state of suspended animation for many years now. Though years have passed since the global financial crisis banks in Europe are still unable to recover and return to pre-crisis levels. British banks are no exception as well. Once known for their worldwide reach, excellent service and stable growth, major British bank today are a bad joke. British bank stocks have let down investors for years and years and there seems to be no light at the end of the tunnel. While banks in UK, followed their American peers in their operations, they failed to cleanup their balance sheets and raise capital after the crisis hit. A multitude of factors contributed to the slow and continued collapse of British banking including incompetent management, bloated branch numbers and employees, dithering by regulators, too late and high state intervention, inability to cut down expenses and earn profits, etc.

Here is an excerpt from an article on British bank stocks in FE Trustnet:

UK banks are cheap but not attractively-valued given the number of impending headwinds facing the sector, according to a number of star managers.

Neil Woodford, SVM UK Growth’s Margaret Lawson and Liontrust’s Stephen Bailey all warn against holding any of the larger incumbent banks due to a combination of precarious balance sheets, legacy issues and the current ultra-low interest rate environment.

The UK banking sector has had a torrid time post the financial crisis, with the FTSE 350 Banks index underperforming the FTSE 350 by 87.81 percentage points since the start of 2008 with a total loss of 46.85 per cent.

UK Banks Stock Index Return

A lack of trust since the crisis combined with a series of misconduct-related fines appears to have taken its toll on the sector, with many investors believing the firms to be opaque, unreliable and vulnerable to further regulatory penalisation.

Seeing as we’re in the midst of an unusually long economic cycle, which has led to toppy valuations across many equities, some deep value investors have been won over by banks’ cheap valuations.

Expecting steady and consistent dividend payments from British banks are still a far from becoming a reality.

Fellow FE Alpha Manager Stephen Bailey says that, while the best opportunities in dividend growth is within the financials sector, this doesn’t include any of the incumbent banks as he deems them to be unattractive and un-investable.

For instance, he points out that RBS has recently had to postpone its first dividend payment, Barclays has halved its dividends, Lloyds has paid a dividend but it was generated from capital as opposed to earnings and HSBC is paying an unfeasibly high dividend despite balance sheet strains.

Source: Should you avoid this attractively-valued sector?, FE Trustnet, April 27, 2016

Of the major UK banks available for trading on the US market, Barclays (BCS) is down about 21% year-to-date and closed today at $10.20.Fellow peer Lloyds (LYG) is trading at just over $4 a share and is down 5% YTD. The Royal Bank of Scotland Group is royal only in its name. Trading at under $8 a share it is nearly 17% so far. Standard Chartered PLC (SCBFF) closed at $8.17 today and HSBC Holdings plc (HSBC) if off by about 14%. A few months ago HSBC started a drama with plans to move its headquarters some place else outside of London. After many months of rumors and drama eventually it decided to stay put. This is an example of how British banks have a tendency to focus on things that are stupid and useless.

Investors looking at European financials can avoid the large-cap British bank stocks for now.

Disclosure: Long LYG