Interesting article on Brexit and its implications in the latest edition of Bloomberg BusinessWeek. Here is a chart showing the options available for UK:
Click to enlarge
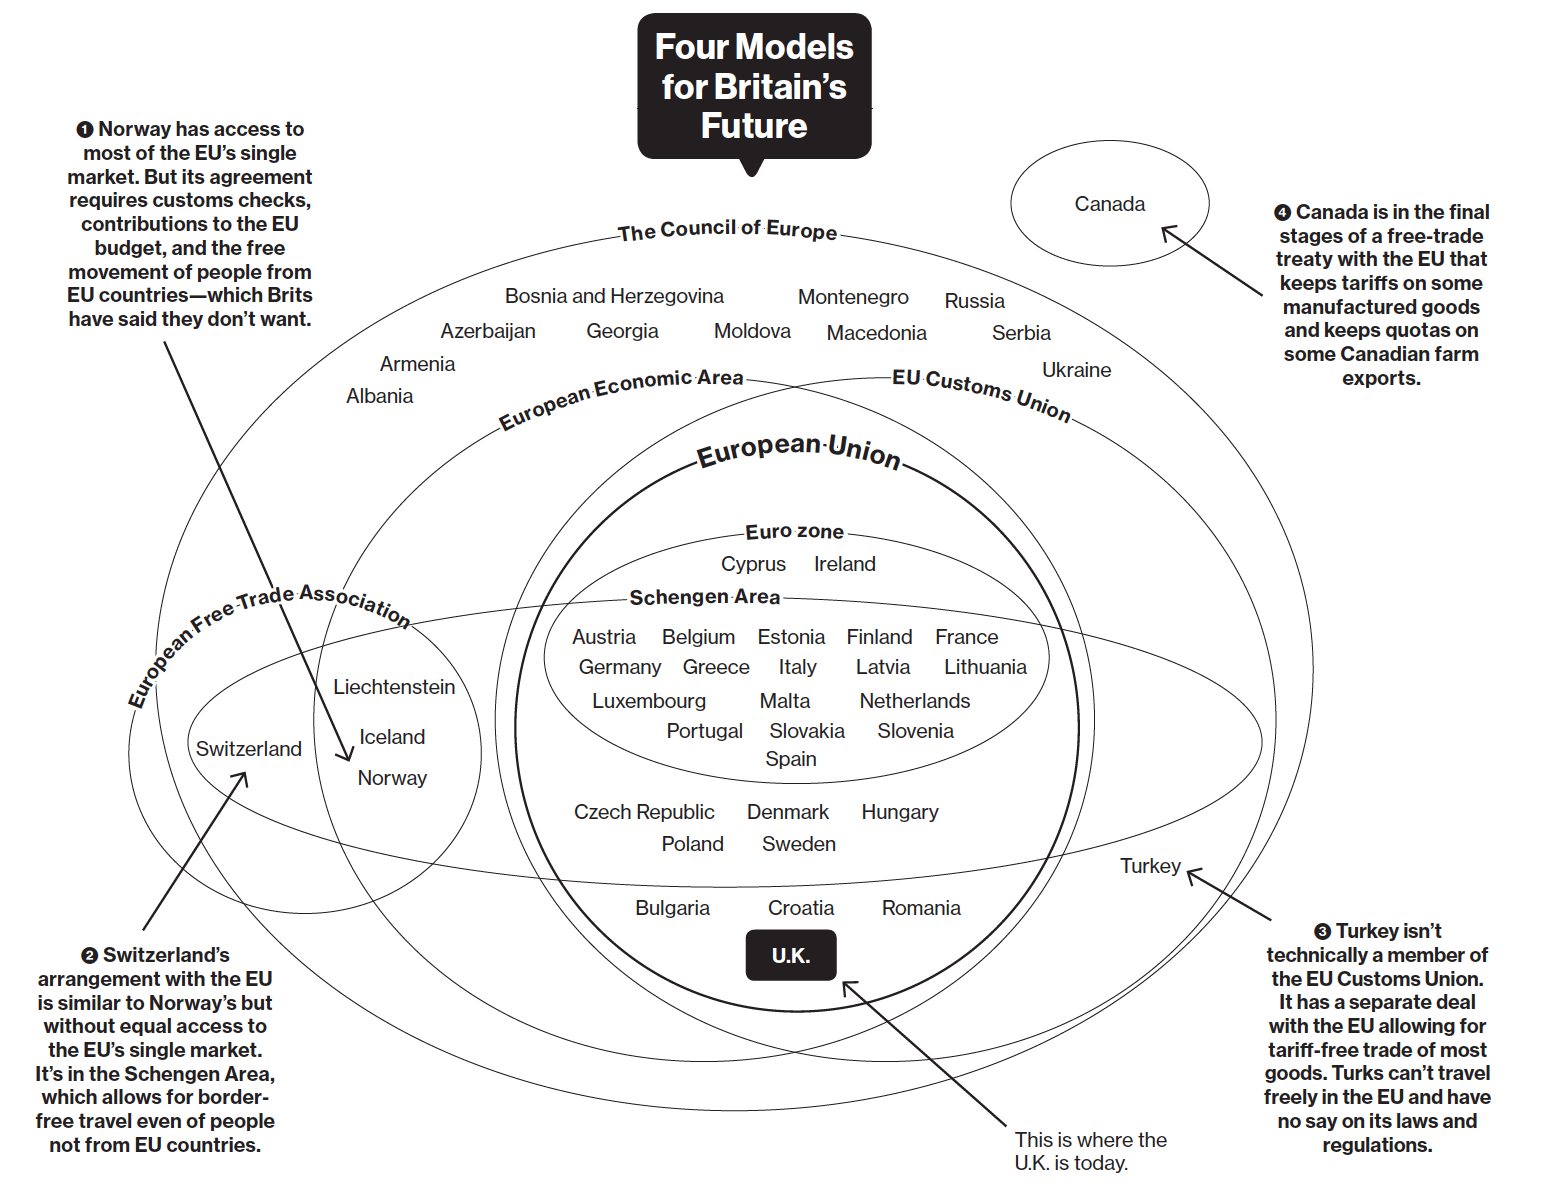
The full article is worth a read..
Source: After Brexit, Here’s What’s Next for Europe, Bloomberg BusinessWeek