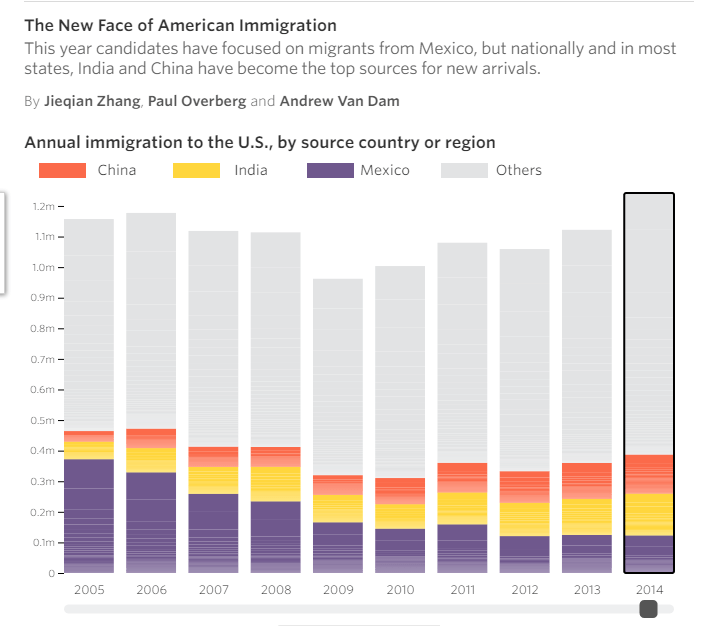
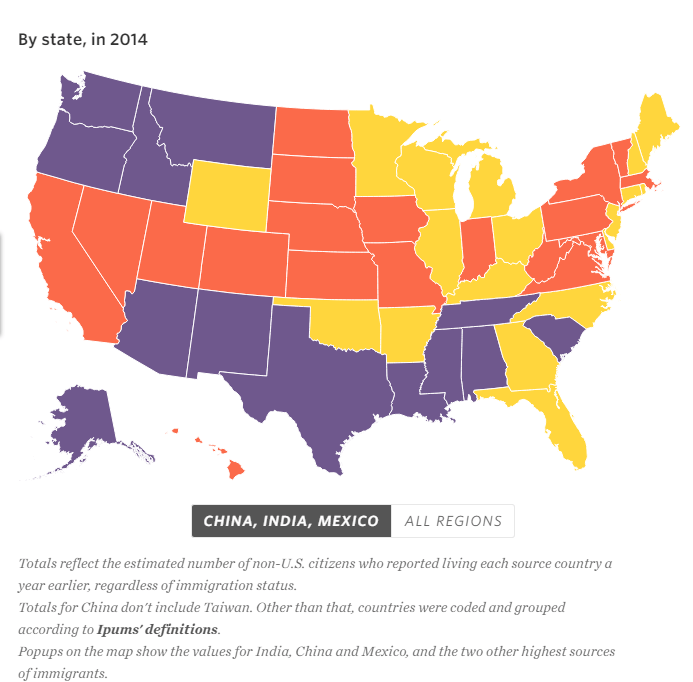
China and India have become the top source of new arrivals into the US overtaking immigrants from Mexico according to a WSJ article yesterday. While in the past Mexicans were the largest group of migrants in recent years migration from Mexico has slowed. From the article:
Chinese and Indian newcomers to the U.S. are now outpacing Mexican arrivals in most regions of the country, a marked reversal from a decade ago, when immigrants from America’s southern neighbor dwarfed arrivals from the large Asian countries.
A Wall Street Journal analysis of census figures shows that in Illinois, New York, Ohio, Virginia, Florida, Georgia and other states, more immigrants from China and India arrived than from Mexico in 2014, the most recent year for which data are available.
That year, about 136,000 people came to the U.S. from India, about 128,000 from China and about 123,000 from Mexico, census figures show. As recently as 2005, Mexico sent more than 10 times as many people to the U.S. as China, and more than six times as many as India.
The figures include people who come legally and illegally, but don’t distinguish between the two. While Chinese and Indian immigrants are far more likely to be in the U.S. legally than those from Mexico, Asians represent one of the fastest-growing segments of undocumented immigrants in the country, researchers say. People from Mexico and other Central American countries account for about 71% of the U.S. unauthorized immigrant population, while Asians account for the second-largest share at 13%, according to the Migration Policy Institute.
Click to enlarge
Additional reporting from Janet Adamy
Source: Census Bureau via University of Minnesota (Ipums)
Source: Immigration Source Shifts to Asia From Mexico by Janet Adamy and Paul Overberg, WSJ, Sept 7, 2016
A cool interactive graphic for the above piece can be found here: The New Face of American Immigration
In the 1800s and up until 1969, Europeans dominated migration to the U.S. as shown in the chart below:
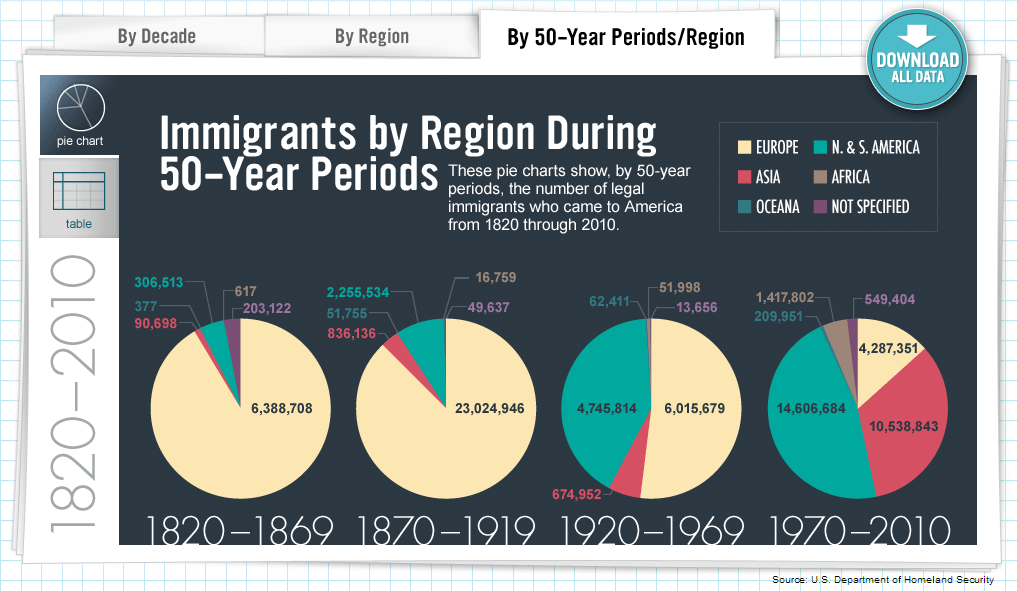
Laws like The Immigration Act of 1924, or Johnson–Reed Act, including the National Origins Act, and Asian Exclusion Act effectively banned Asians, Arabs and Africans into the country. A Wikipedia post notes that “the purpose of the act was “to preserve the ideal of American homogeneity” . Of course, times have changed and today there are only a handful of countries that are homogeneous.
Related: