On the Performance of Foreign Bank Stocks Year-To-Date

Among the foreign bank ADRs, emerging market banks have performed very well so far this year relative to their developed world peers. This is not surprising since most emerging markets are up by double digit percentage points this year and financials are the main drivers of growth in these markets. As the pillars of the local economy banks tend to perform well when the overall economy in in expansion mode.

The table below shows the year-to-date price returns of foreign bank stocks:

S.No.BankTickerShare Price on Sept 8, 2016Year-To-Date % ChangeCountry
1Banco BradescoBBD$9.39114.87%Brazil
2Banco Bradesco - ComBBDO$9.4097.89%Brazil
3Banco Santander BrasilBSBR$7.1082.52%Brazil
4Itau UnibancoITUB$11.4175.27%Brazil
5BancolombiaCIB$42.0757.27%Colombia
6Woori BankWF$30.8136.33%Korea
7Banco MacroBMA$77.2732.95%Argentina
8KB Financial GroupKB$35.7928.42%Korea
9Banco Santander ChileBSAC$21.3420.98%Chile
10HDFC BankHDB$73.5519.40%India
11Banco de ChileBCH$67.4716.11%Chile
12Grupo Financiero GaliciaGGAL$30.2011.52%Argentina
13Shinhan FinancialSHG$37.2110.78%Korea
14BBVA Banco FrancesBFR$20.457.18%Argentina
15ICICI BankIBN$8.265.49%India
16Banco SantanderSAN$4.73-2.87%Spain
17HSBCHSBC$38.19-3.24%United Kingdom
18Westpac BankingWBK$22.85-5.70%Australia
19Sumitomo Mitsui FinancialSMFG$7.01-7.64%Japan
20Banco Bilbao Vizcaya ArgentariaBBVA$6.46-11.87%Spain
21Mizuho FinancialMFG$3.48-13.86%Japan
22Mitsubishi UFJ FinancialMTU$5.35-13.99%Japan
23Lloyds Banking GroupLYG$3.17-27.29%United Kingdom
24Barclays BankBCS$9.23-28.78%United Kingdom
25Credit SuisseCS$13.66-37.02%Switzerland
26Royal Bank of ScotlandRBS$5.37-39.46%United Kingdom
27Itau CorpBancaITCB$13.16-8.80%Chile

Note: The above returns are only price returns (excluding dividends)

Source: BNY Mellon

A few observations:

  • Brazilian lender Banco Bradesco(BBD) has more than doubled. But it has only doubled from single digit prices. The other two Brazil banks noted above have soared also.
  • With oil rices rising and peace returning to the country, Colombia’s BanColombia has increased by over 57%.
  • British and other developed European lenders are still struggling to recover from years of poor returns.For example, Royal Bank of Scotland(RBS) is down about 40% and continues to let down investors for years in a row.

Disclosure: Long CIB, BBD, ITUB, SAN, BBVA, BSAC, BCH
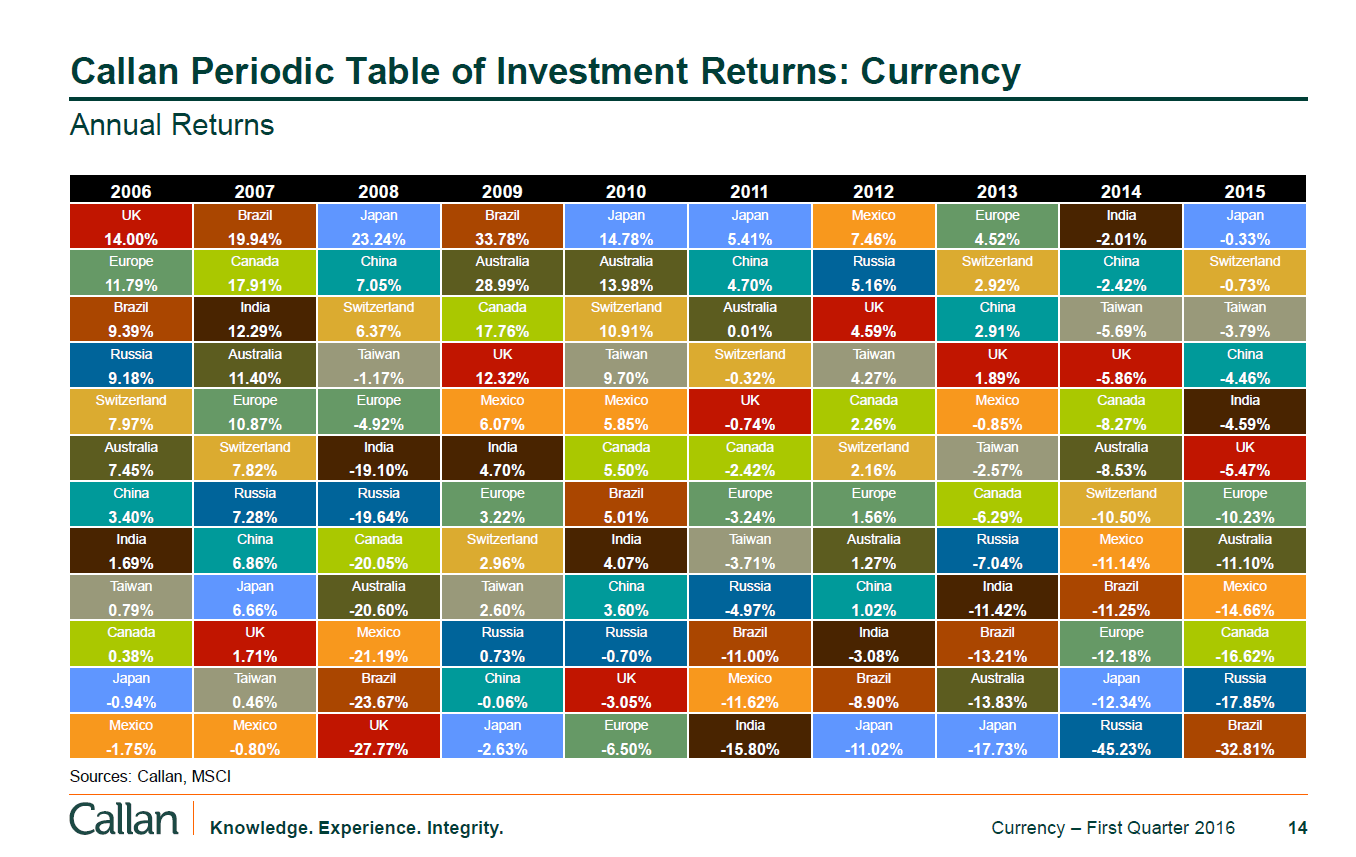
Callan Periodic Table of Investment Returns: Currency

The currency market is the largest market in the world with trillions of dollars worth of global currencies traded. This market is larger than equities, oil and bond markets. One of the reasons that currency markets are bigger than equity markets is because central bank are the major participants in the market. On a daily basis these banks and other institutions trade currencies with one another.

However currency trading is not suitable for most retailers for many reasons. For example, currencies are extremely volatile and can move either direction for any number of reasons including political stability or the lack of it. Hence the majority of retail investors are better off to stay out of the currency markets.

The chart from Callan Associates below shows the annual returns of major currencies from 2006 to 2015:

Click to enlarge

Callan Periodic Table of Investment Returns-Currency

Source: Callan Associates

Related: The Callan Periodic Table of Investment Returns 2016: A Review

Immigration to US: Chinese and Indians Overtake Mexicans

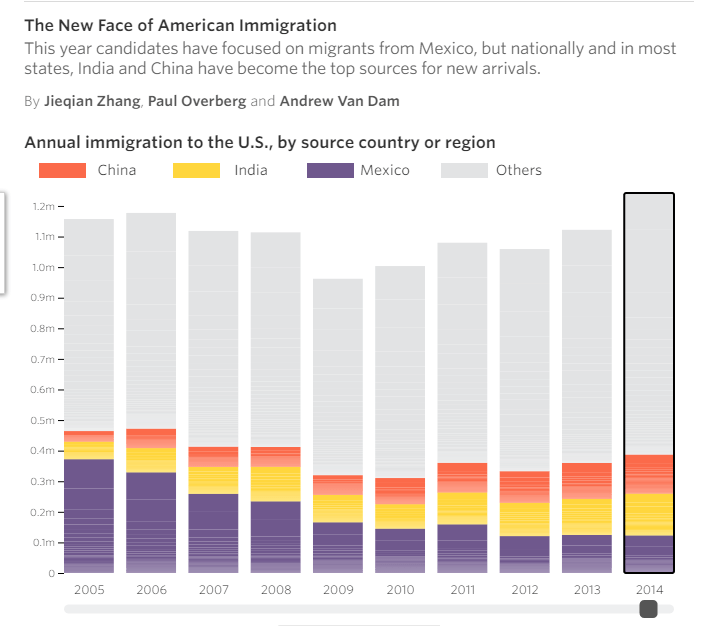
China and India have become the top source of new arrivals into the US overtaking immigrants from Mexico according to a WSJ article yesterday. While in the past Mexicans were the largest group of migrants in recent years migration from Mexico has slowed. From the article:

Chinese and Indian newcomers to the U.S. are now outpacing Mexican arrivals in most regions of the country, a marked reversal from a decade ago, when immigrants from America’s southern neighbor dwarfed arrivals from the large Asian countries.

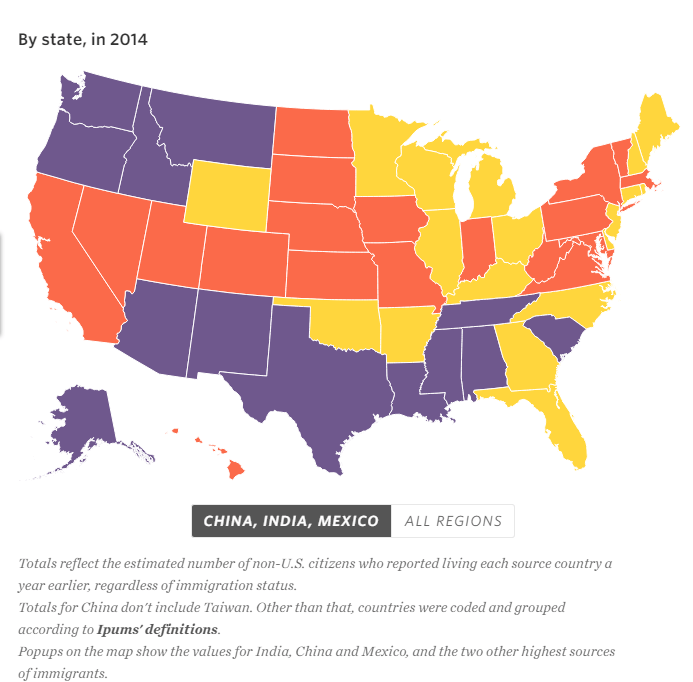
A Wall Street Journal analysis of census figures shows that in Illinois, New York, Ohio, Virginia, Florida, Georgia and other states, more immigrants from China and India arrived than from Mexico in 2014, the most recent year for which data are available.

That year, about 136,000 people came to the U.S. from India, about 128,000 from China and about 123,000 from Mexico, census figures show. As recently as 2005, Mexico sent more than 10 times as many people to the U.S. as China, and more than six times as many as India.

The figures include people who come legally and illegally, but don’t distinguish between the two. While Chinese and Indian immigrants are far more likely to be in the U.S. legally than those from Mexico, Asians represent one of the fastest-growing segments of undocumented immigrants in the country, researchers say. People from Mexico and other Central American countries account for about 71% of the U.S. unauthorized immigrant population, while Asians account for the second-largest share at 13%, according to the Migration Policy Institute.

Click to enlarge


us-immigration-chart-1

us-immigration-chart-2

Additional reporting from Janet Adamy

Source: Census Bureau via University of Minnesota (Ipums)

Source: Immigration Source Shifts to Asia From Mexico by Janet Adamy and Paul Overberg, WSJ, Sept 7, 2016

A cool interactive graphic for the above piece can be found here: The New Face of American Immigration

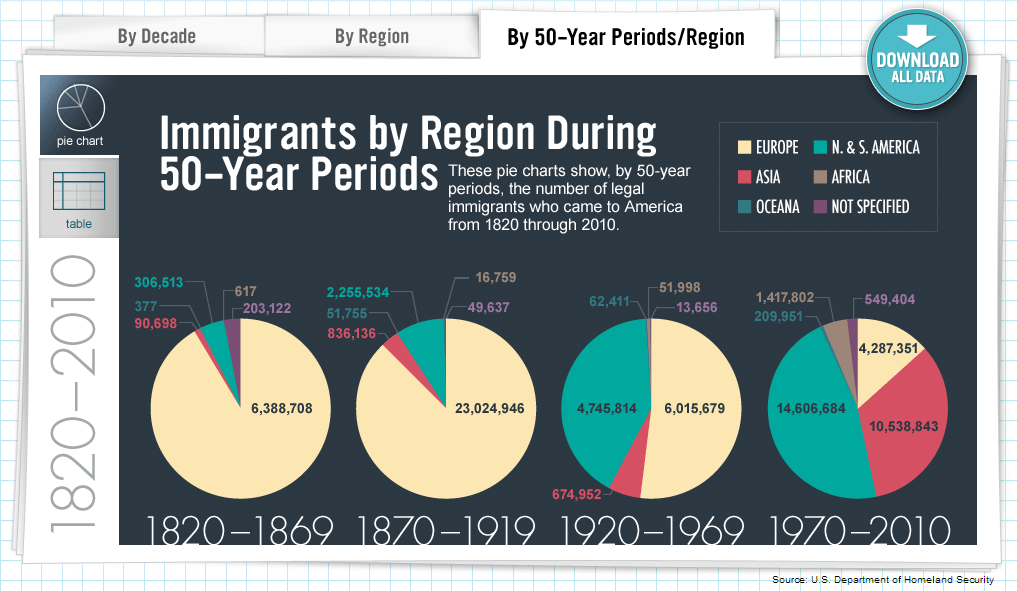
In the 1800s and up until 1969, Europeans dominated migration to the U.S. as shown in the chart below:

3-Immigrants-by-Region-and-50-Year-Periods

Laws like The Immigration Act of 1924, or Johnson–Reed Act, including the National Origins Act, and Asian Exclusion Act effectively banned Asians, Arabs and Africans into the country. A Wikipedia post notes that “the purpose of the act was “to preserve the ideal of American homogeneity” . Of course, times have changed and today there are only a handful of countries that are homogeneous.

Related:

Callan Periodic Table of Investment Returns: Emerging Markets From 2006 To 2015

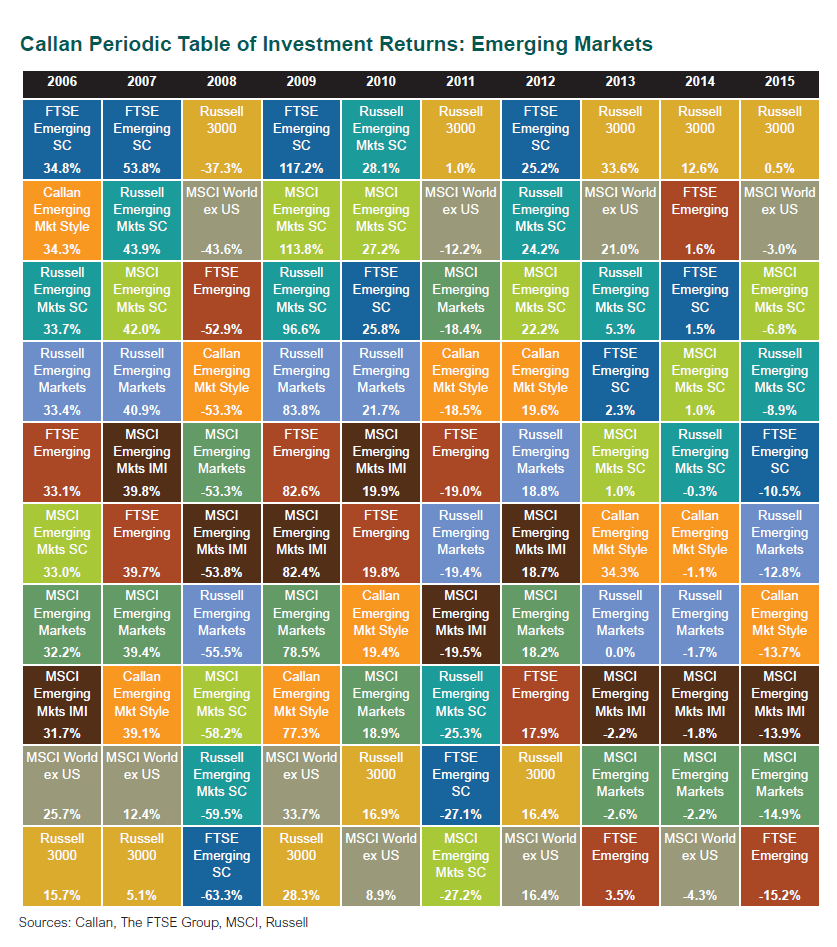
The Callan Periodic Table of Investment Returns for various Emerging Market indices from 2006 to 2015 are shown in the chart below:

Click to enlarge

Callan Periodic Table of Investment Returns-Emerging Markets

Source: Callan Associates

Emerging markets are hot this year with many markets having soared by double digit percentages so far. These markets were also the top performers before the Global Financial Crisis of 2008-09. The widely followed MSCI Emerging Markets Index rose by 32% and 39% in 2006 and 2007 respectively. However in more recent years emerging stocks have let down investors with their poor returns. In 2013, 2014 and 2015 emerging stocks as represented by the MSCI Emerging Markets Index lost money.

Investing in emerging markets is not suitable for all investors. Even investors who can stomach the gut-wrenching rides should allocate only a small portion of their assets to these markets. As in other markets, small caps get crushed more in market downturns than large caps. The FTSE Emerging Markets Small Cap Index (“FTSE Emerging SC” shown above in blue) crashed 63% in 2008.

Related ETF:

  • iShares MSCI Emerging Markets ETF (EEM)
  • Vanguard FTSE Emerging Markets ETF (VWO)

Disclosure: No Positions

Related: The Callan Periodic Table of Investment Returns 2016: A Review

Development Models: China’s Socialism Beats Capitalism?

China follows a unique form of political system called  “market socialism”. In this system, the economy is capitalist to some extent but the political system is communist. Under this system only one party runs the country and no other party is allowed to exist. The state plays a major role in the functioning of the economy. Individuals are given limited freedom to open and run their enterprises and become wealthy in the process if they are successful. The state ensures that the key industries are controlled by the government and the state does not believe in the “markets” and its “invisible hands”. Because political control remains under the firm of the communist party individuals regardless of wealth are basically forced to keep quiet whether they agree with or disagree anything the state does.

On the other hand in countries such as the US that follow capitalism, democracy exists and individuals are allowed full freedom to do anything they wish as long as it is legal. No law prevents anyone from starting a new political party for example or citizens will be crushed by tanks should they protest some actions by the state. In this political system, the state trusts in the “market” and its “invisible hands” to run the economy. The state plays a small role in ensuring laws and regulations are set for participants in the market follow and punish violators. In some ways the state plays the role of a spectator in a show as opposed to someone who actually runs the show.The state also believes that the worst of human beings in a competitive economy will do the best for others and the country. This type of assumption overlooks natural human sins such as greed/lust for wealth and power. The concept of “trickle down economics” is also widely believed and supported. This concept simply means that once some individuals become extremely wealthy due to their hard work and luck, they will start investing their wealth in creating jobs, building factories, etc. to help others who are lower in the economic class system.

With that introduction to two forms of political systems, here is an excerpt from an article by professor John Ross:

China’s ‘socialist development strategy,’ which commenced with its 1978 economic reforms, is radically different in its entire framework and directly counterposed on key policy issues. China used, in Xi Jinping’s phraseology on economic policy, both the ‘visible’ and the ‘invisible hand’ – not simply the private sector but also the state. Indeed, in China itself, as the 3rd Plenum of the Central Committee of the 18th Congress of the CPC insisted: ‘We must unswervingly consolidate and develop the public economy, persist in the dominant position of public ownership, give full play to the leading role of the state-owned sector.’

In social policy, accompanying the economic dominance of the state sector, China did not rely on ‘trickle down’ but, in line with its socialist approach, China:

  • undertook massive and conscious programmes deliberately aimed at eradicating poverty – these are to be completed in the 13th Five Year Plan by 2020 by lifting the remaining 70 million people out of poverty;
  • China deliberately promotes development through urbanisation as a way of moving the population into higher productivity economic sectors;
  • China deliberately sought to narrow the income gap between rural and urban areas;
  • China does not rely exclusively on ‘the market’ but deliberately uses state infrastructure spending to raise the economic level of its less developed inland provinces;
  • legally China guaranteed private property but a key economic role was assigned to the state sector,
  • politically China was socialist.

What, therefore, were the factual outcomes of these two radically different approaches to economic development? To assess this, for reasons which will become evident from the statistics, not only will China itself be analysed but three other countries will be considered. These are Vietnam, which defines itself as socialist and which in reality drew heavily from China’s ‘socialist market economy’ approach, Cambodia, and the Lao People’s Democratic Republic – the latter two also being highly influenced by China’s development model.

The facts are summarised in Table 1 which shows the annual average rate of per capita GDP growth up to 2015 from 1978, when China began its economic reforms, from 1989, when the Washington Consensus was put forward, and from 1993 when data for Cambodia becomes available.

The data is of course extremely striking – indeed conclusive. From 1993-2015, when all four countries can be analysed China, Cambodia, Vietnam and Laos ranked respectively 1st, 2nd 3rd, and 4th in world per capita GDP growth – peripheral cases of countries with populations of less than 5 million or dominated by oil production are not included. From 1989, the date of the putting forward of the Washington Consensus, to 2015 China, Vietnam and Laos ranked respectively 1st, 2nd and 3rd in the world for countries in per capita GDP growth. From 1978 onwards China ranked 1st among all economies in terms of economic growth.

This ranking of growth necessarily shows that China’s economic model not only produced more rapid growth than developed economies but also capitalist economies at the same stage of economic development (level of per capita GDP).

Table 1

16 08 23 Chart 1


Source: Data shows China’s ‘socialist development model’ outperformed capitalist development strategies, John Ross, Senior Fellow at Chongyang Institute for Financial Studies, Renmin University of China, Key Trends in Globalisation

Dr. Ross’ point about eradication of poverty is surprising. He notes (emphasis added):

From 1981 China lifted 728 million people out of World Bank defined poverty. Another socialist country, Vietnam, lifted over 30 million from poverty by the same criteria. The whole of the rest of the world, in which the dominant model advocated by the IMF was the Washington Consensus, lifted only slightly 120 million people out of poverty.

The entire article is worth a read.

You may also want to the following related story in the NY Times.

From Venture Communism: How China Is Building a Start-Up Boom:

The Chinese Communist Party doesn’t trust the invisible hand of capitalism alone to encourage entrepreneurship, especially since it is a big part of the leadership’s strategy to reshape the sagging economy.