Yields on various asset classes such as cash, bonds have declined significantly in the past few years especially in the developed world. For example, cash hardly earns any interest today in the US compared to around 3% average before the global financial crisis. For investors willing to take risk, local emerging market bonds are attractive at current levels according to an article by Richard Turnill of Blackrock.
Click to enlarge
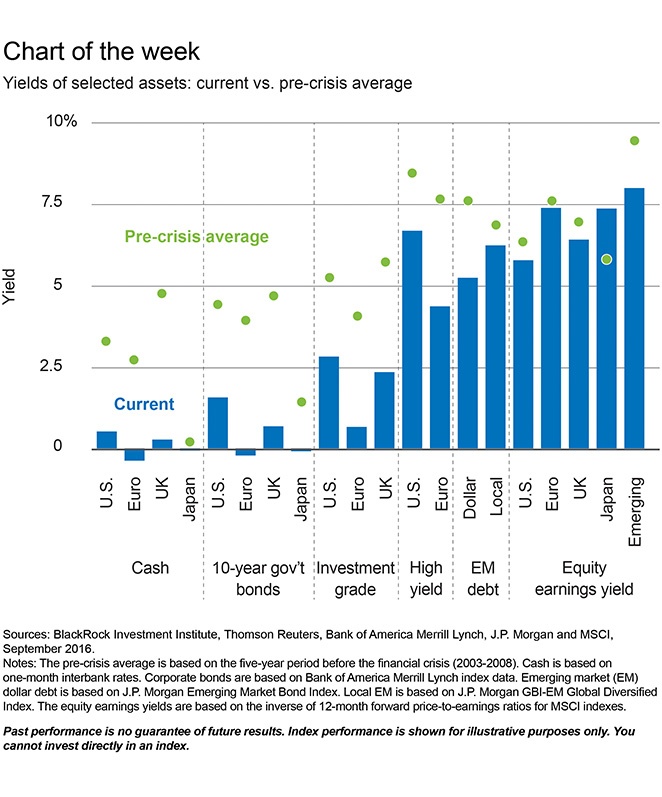
Source: Position for the macroeconomic shift ahead, Blackrock, Oct 3, 2016