The Vanguard 2016 Index Chart Shows Why Investing for the Long-Term is Important

One of the critical factors for success in equity investing is investing for the long-term which can considered as 5 years of more. Holding solid high-quality stocks for 10 years or even decades can create fabulous wealth.

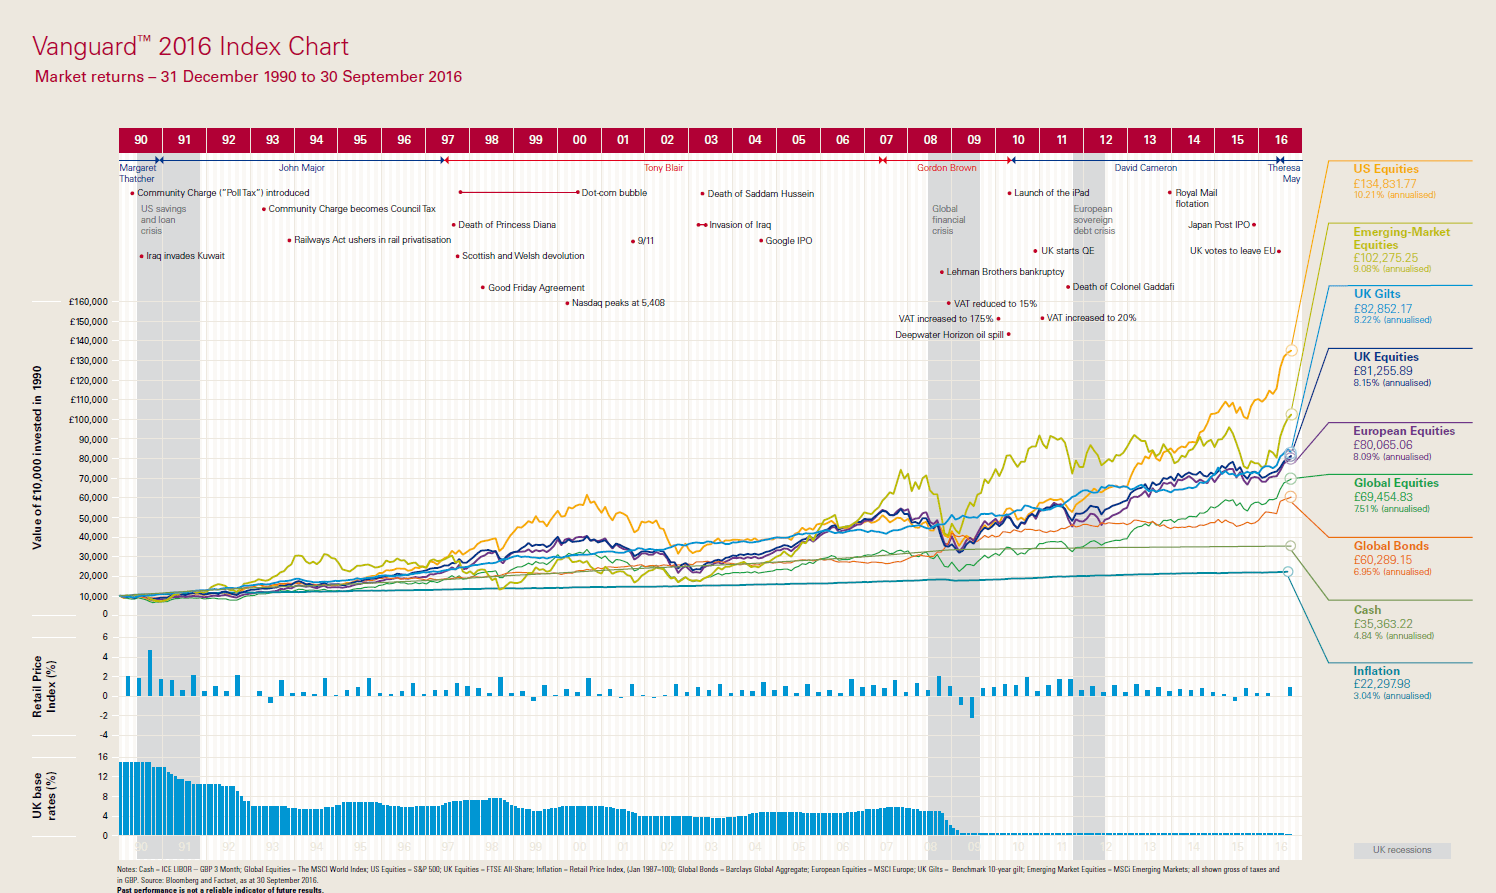
The UK edition of The Vanguard 2016 Index shows the power of long-term investing and diversification:

Click to enlarge

Source: The Vanguard 2016 Index – Putting market moves into long-term perspective, Vanguard UK

Over 26 years from December 1990 thru September 2016, an investment of 10,000 pounds by a UK investor would have grown to over 134,000 pounds if invested in U.S. stocks for an annual return of over 10%. The same investment in Emerging stocks would have produced a growth of over 9% annual return. UK equities would have returned an annual return of over 8%.

Overall this chart shows, over the long-term stocks beat bonds and cash.

In the years since 1990, many world events including some very significant  ones have occurred as noted in the chart. Despite all the positive and negative world events, stocks continued to march upwards.

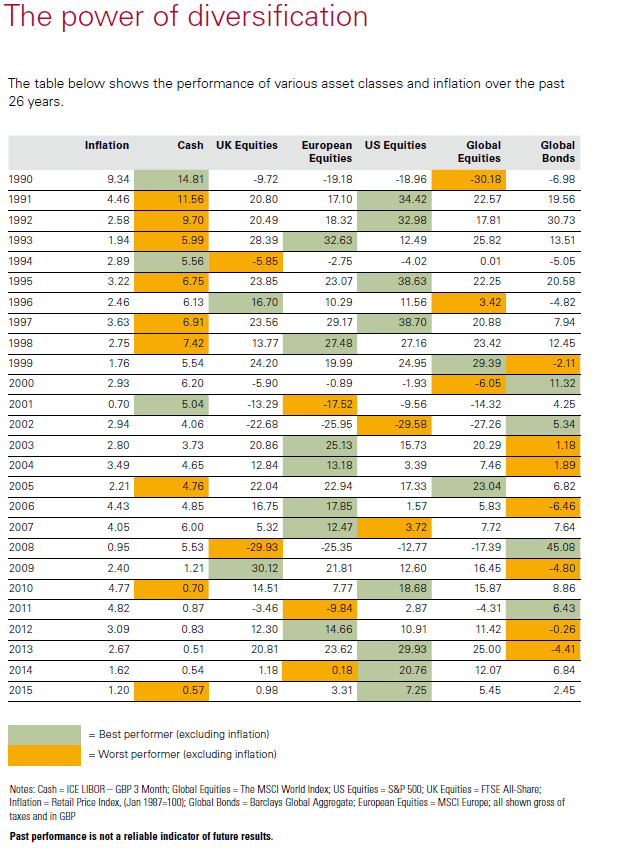
The table below shows the importance of diversification:

Click to enlarge

Source: The Vanguard 2016 Index – Putting market moves into long-term perspective, Vanguard UK

Download: The Vanguard 2016 Index (UK Edition in pdf)

Related ETFs:

  • SPDR S&P 500 ETF (SPY)
  • Vanguard Dividend Appreciation ETF (VIG)
  • iShares MSCI Emerging Markets ETF (EEM)
  • Vanguard MSCI Emerging Markets ETF (VWO)
  • iShares MSCI United Kingdom Index (EWU)

Disclosure: No Positions

The Top 10 S&P 500 Companies by Cash and Cash Equivalents

U.S. firms hoard billions of cash and equivalents unable to deploy them for growth or distribute them with shareholders. Some of this cash is stashed abroad to avoid paying high US corporate taxes. In September I wrote an article listing the Top 25 Global Public Cash-Rich Companies. In this post let us take a quick look at US firms holding the most cash. More specifically these are large companies in the S&P 500 index.

According to an article by Andrew Birstingl of FactSet, all the firms in the S&P 500 index (excluding Financials) cash and cash equivalents balance amounted to $1.54 Trillion at the end of the third quarter, the largest cash total in 10 years.The top 20 companies by cash balance accounted for an astonishing 52.5% of the total cash balance of the index. So more than half of the $1.54 Trillion is held by just 20 companies.

Quarterly Cash and Short Term Investments of SP 500 Index:

Click to enlarge

The Top 10 S&P 500 Companies By Cash and Cash Equivalents:

Source: Q3 Cash Balance Reaches New High, Grows 7.6% to $1.5 Trillion, FactSet, Dec 21, 2016

All the top five firms in the above list are in the hi-tech sector. These firms derive a high portion of their earnings from foreign countries and much of the cash is held overseas which may be repatriated if the corporate tax regime is changed. At the end of 3rd quarter Microsoft(MSFT) and Alphabet (GOOG) had a cash balance of $136.9 billion and $83.1 billion respectively. The other top IT firms in the list are Cisco(CSCO), Oracle(ORCL) and Apple(AAPL).

The healthcare firms in the list are drug maker Johnson & Johnson(JNJ), biotech companies Amgen(AMGN) and Allergan plc(AGN).

Disclosure: No Positions

Which Sectors Outperform When Interest Rates Rise?

Some sectors of the equity market perform when interest rates rise and vice versa. Based on an analysis of historical data, a report by Fidelity Investments notes that high-yielding sectors like utilities and consumer staples under-perform when rates rise. On the other hand, financials outperform the overall market when rates increase.

Click to enlarge


Source: A new era for dividend stocks, Fidelity

It should be noted that other factors like valuation, dividend payout ratio, dividend paid or not, etc. have to considered in addition to interest rates before making investment decisions.

The Futility of Savings When Interest Rates Are Low

Albert Einstein once said “Compound interest is the eighth wonder of the world. He who understands it, earns it … he who doesn’t … pays it.” Compounding simply implies earning interest on interest to multiply one’s cash savings. The power of compounding works well only when the interest rate offered on a savings account is decent. While savings/checking accounts earned 5% of even more in the past, for many years now it hardly earns anything.

The following chart from an article at This is Money, UK site shows the impact of compounding on an interest rate of 4% vs 0.25%:

Click to enlarge

Source: Has compound interest lost its magic? How saving is NOT the secret to growing cash when rates are so low, This is Money

From the above article:

Let’s do the maths. As an example, let’s say you put £10,000 into a deposit account, with 0.25 per cent interest, accrued daily and paid, and therefore compounded, annually. This is fairly typical of high street deposit accounts.

After ten years, you would have received £252.83 in interest. Almost all of this, £250, is the simple interest, that is, interest before compounding. The total effect of compounding, the interest paid on interest, is £2.83. [Figures 1 & 2]

It is a staggeringly small amount. It is telling us that at current interest rates, saving in the traditional sense, as a means to accumulate capital, is redundant.

Fortunately savers who are willing to take risk have options to earn higher returns than simply stashing their savings in banks. Stocks and bonds are two options where savers can put their money to work. For example, high dividend-paying stocks offer a better alternative than letting the money sit in a savings or checking account. Moreover due to the adverse effect of inflation, a saver earning no or tiny interest rates on savings actually loses money over time.

On The Issue Of Home Bias Of Stock Market Investors

One of the factors that affects investors in the construction of a equity portfolio is the issue of home bias. Because of this issue investors to tend to avoid investing in foreign stocks.

An investor building a globally diversified portfolio must allocate assets based on the market-cap weighting of each country in a broad global index such as the the MSCI All Country World Index. To put it another way, if a country has a 5% market weighting in this index then an investor must invest of 5% of his/her portfolio in that country to truly achieve the benefits of diversification. However many investors have a home bias due to which they tend own more stocks from their own country than the market-cap weighting in an index.

The chart below shows the home bias of equity investors in select countries:

Click to enlarge

Source: The global case for strategic asset allocation/home bias, Vanguard UK

The chart shows that though US accounts for only about half of the weighting in the global index, American investors own about 79% of their portfolio assets in domestic equities. So they own more than what is suggested by the global index. Hence US investors may lose out on gains from foreign stocks since they own less of them.Similarly Canadians own 59% of their portfolio in domestic stocks when the country accounts for about 3% in the global index. So they are over exposed to the local market.

Some of the factors that influence investors in owing foreign stocks are shown below:

In general, it is not easy to overcome home bias.Most investors feel comfortable with the companies they know and are more familiar with than foreign companies. Moreover they may also use products of companies that are easier to access in the domestic market than some unknown company in a faraway land. For example, an average American may know popular companies Johnson&Johnson(JNJ), Starbucks(SBUX), Alphabet(GOOG), Home Depot(HD), General Mills(GIS), etc. than most of their foreign peers. Some of the foreign peers are firms like GlaxoSmithKline (GSK), Unilever PLC (UL), Nestle SA (NSRGY), UK-based Whitbread plc – owner of Costa Coffee(WTBCY), etc.

Disclosure: Long GIS