Australian banks have been one of the poor performers among the developed world’s banks for many years. In fact, the stock prices of the major banks except Commonwealth Bank are below where they were 10 years based on prices in the domestic market. The banks have gone nowhere per most investors. The following chart shows the performance of the banks in the past 10 years on the Australian market:
Click to enlarge
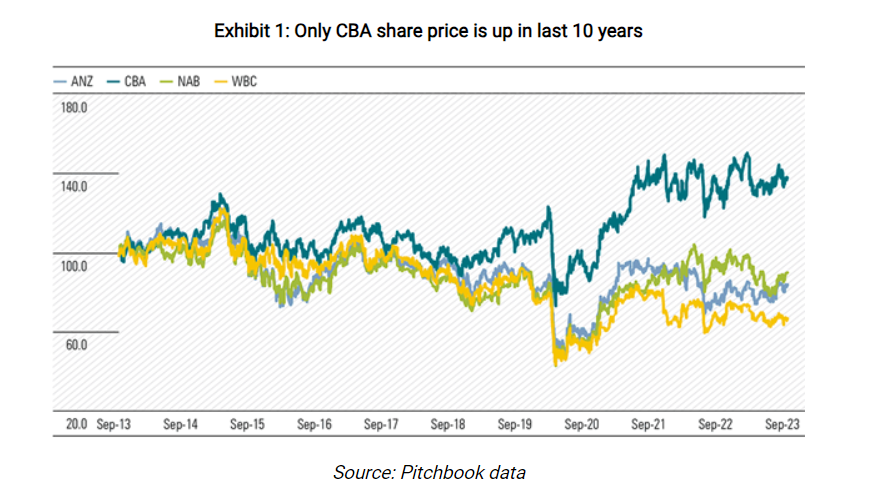
Source: Can Aussie banks rediscover their glory days?, FirstLinks
However the saying that bank stocks have gone nowhere is only partially true. Because if we include dividends in the return calculation then their returns are not bad. From the above article:
Shares have gone nowhere, why invest?
Westpac and ANZ shares are down 33% and 17% respectively, in the last 10 years. With dividends, the returns are more respectable but still not great. Since August 2013, Westpac has paid fully franked dividends totaling $15.49 per share, ANZ not far behind at $15.19. This lifts 10-year total shareholder CAGR to 1.4% for Westpac and 3.6% for ANZ. National Australia Bank has done a little better with total shareholder CAGR of 4.3%. The S&P/ASX 200 total return index has returned around 8% per year for the period.
We forecast Westpac’s ROE to be 9.5% in FY24, down from 15% ten years ago. The financial services royal commission, anti-money-laundering breaches, asset divestments, and lower interest rates have driven the earnings decline. Net interest margins, or NIM, has weakened, asset divestments have halved non-interest income, and operating expenses have risen on risk, compliance and technology spend. Meanwhile, Westpac now holds an additional $24 billion in shareholder equity, a more than 50% increase. Not a pretty story and explains the share price weakness.
But we think the next five years will look different. Margins are recovering from FY22 lows and smaller banks and nonbank lenders are struggling to compete as funding costs rise. Cost savings look achievable given the bloated cost base while recent changes make it unlikely APRA will again lift capital requirements.
Market expectations are now low, which we think is an opportunity. At the current share price, the FY24 PE of 11x and price/book of 1.0x seem to imply no operational and profit improvement. By contrast, Westpac traded on a P/E of 13x and price/book value of 2.2x in 2012 and an average price/book of 1.6x for the 10 years to 2022.
The chart below shows the year-to-date return of Aussie bank stocks available on the US markets:
Click to enlarge
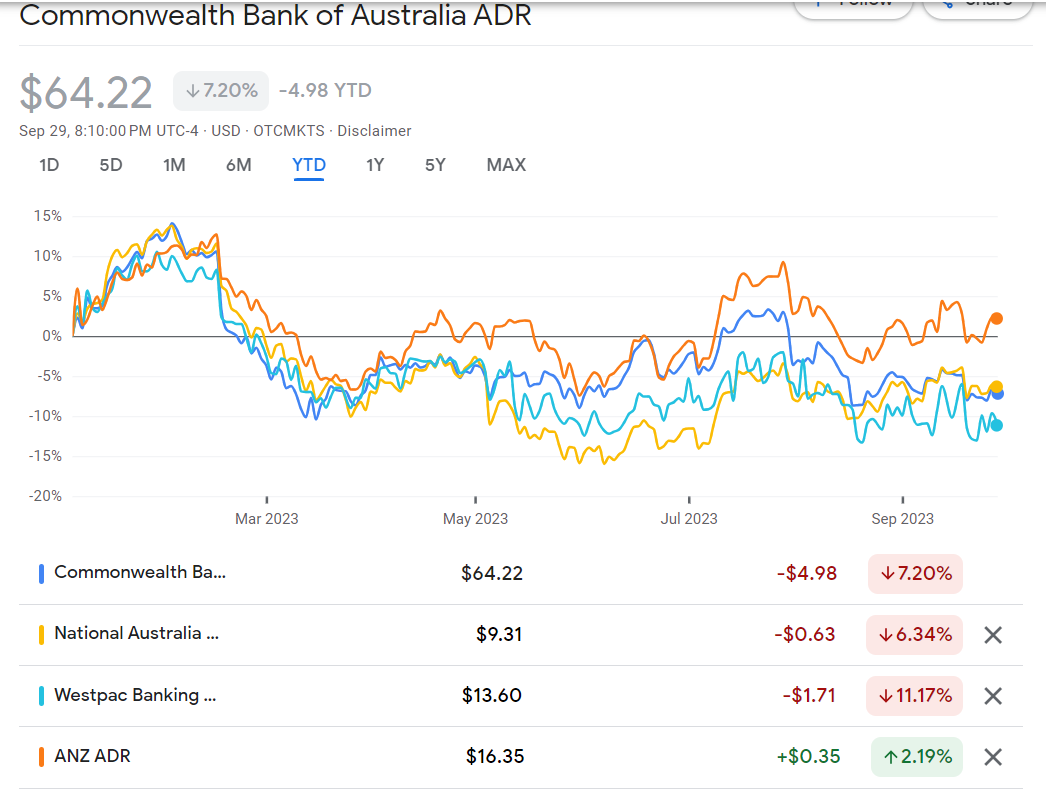
5-Year returns:
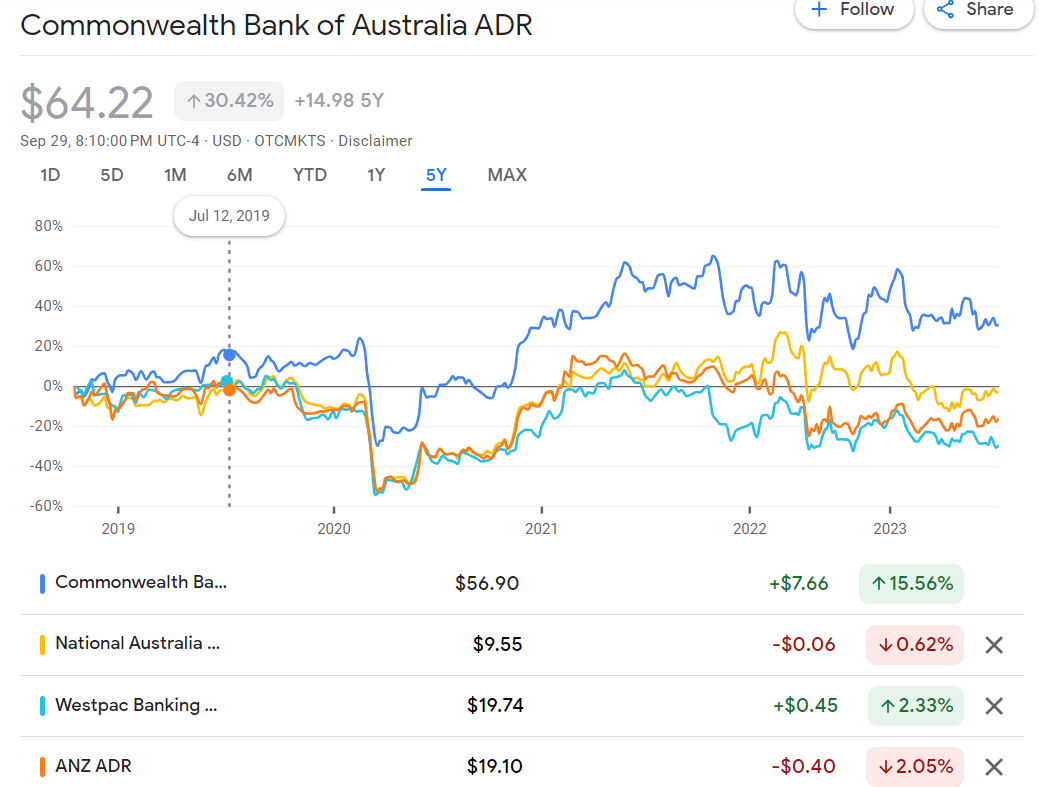
Source: Google Finance
The worst performer in the past years is Westpac(WEBNF). The author of the above article projects a 30% upside for Westpac from current levels. Commonwealth bank is expensive.
So investors looking to earn a high income in the form of dividends and any potential upside in prices in the next few years can consider all banks except Commonwealth.
Referenced Stocks:
- Westpac Banking Corp (WEBNF)
- Australia and New Zealand Banking Group Ltd (ANZGY)
- National Australia Bank Ltd (NABZY)
- Commonwealth Bank of Australia (CMWAY)
Disclosure: Long NAZBY and WEBNF