The World’s Deepest Gold Mine is Mponeng in South Africa. The chart below shows some of the interesting facts about this gold mine:
Click to enlarge
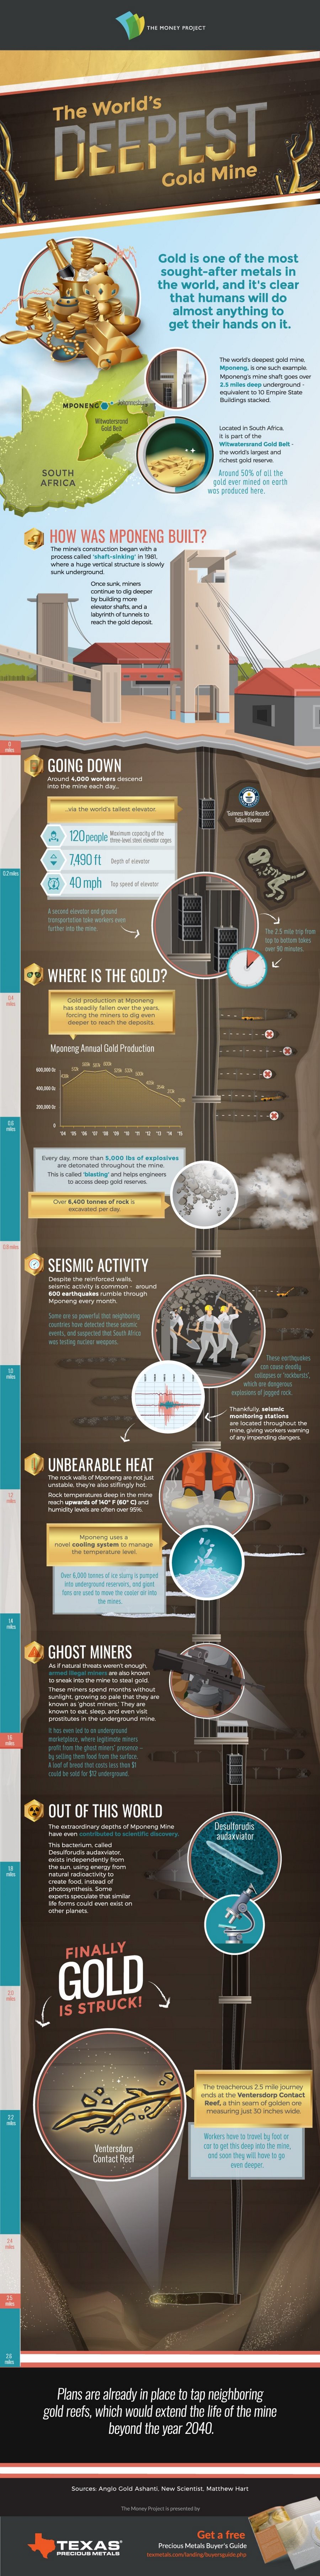
Source: INFOGRAPHIC: The world’s deepest gold mine, Mining.com
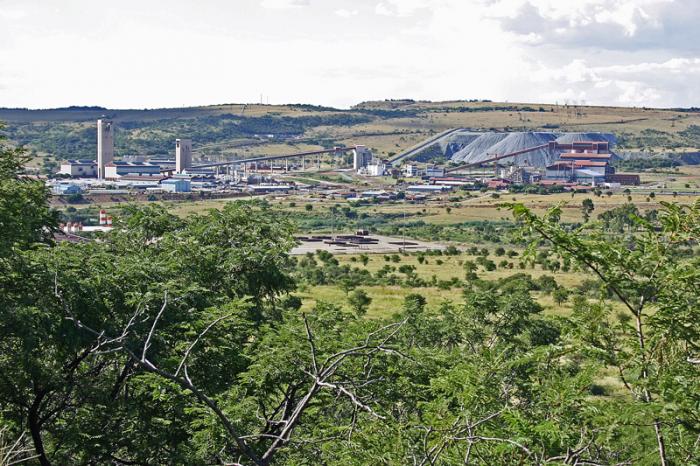
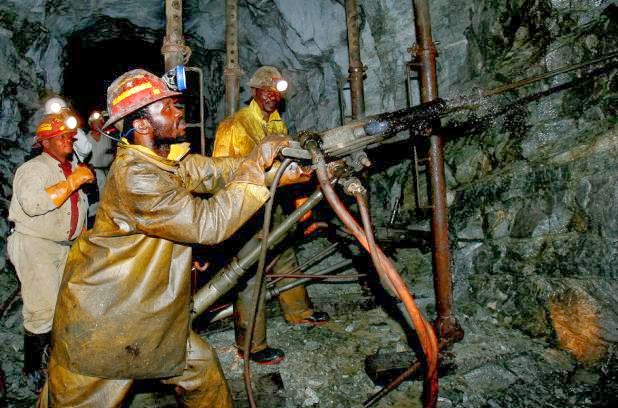
Photos:
Also checkout this documentary on this mine: