For US investors only: Below is a neat flowchart showing how to do backdoor Roth IRA contributions for 2017:
Click to enlarge

For US investors only: Below is a neat flowchart showing how to do backdoor Roth IRA contributions for 2017:
Click to enlarge
The growth of a $1,000 investment in the cryptocurrency bitcoin and S&P 500 in June 2010 is shown in the chart below. The bitcoin investment would have shot up like rocket to reach towards the $100 million mark compared to the tiny rise with the S&P 500:
Click to enlarge
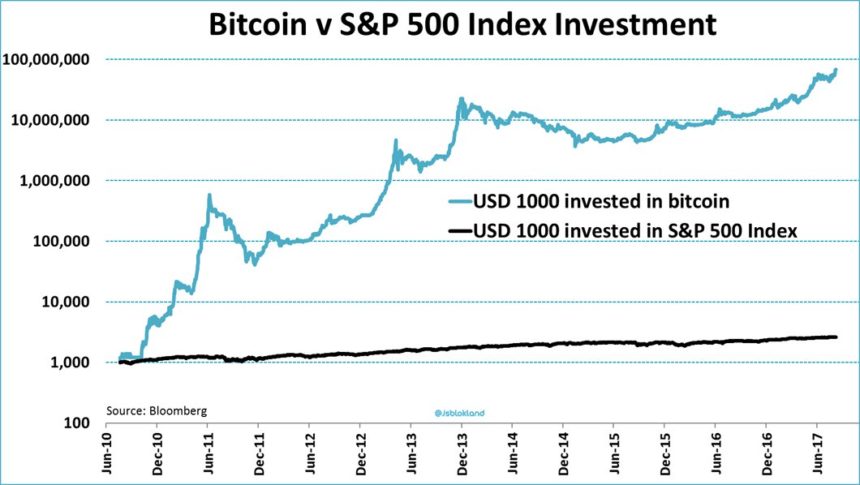
Source: Chart of the Day: Bitcoin vs. S&P, Canadian Investment Review
Below is the long=term chart of bitcoin:
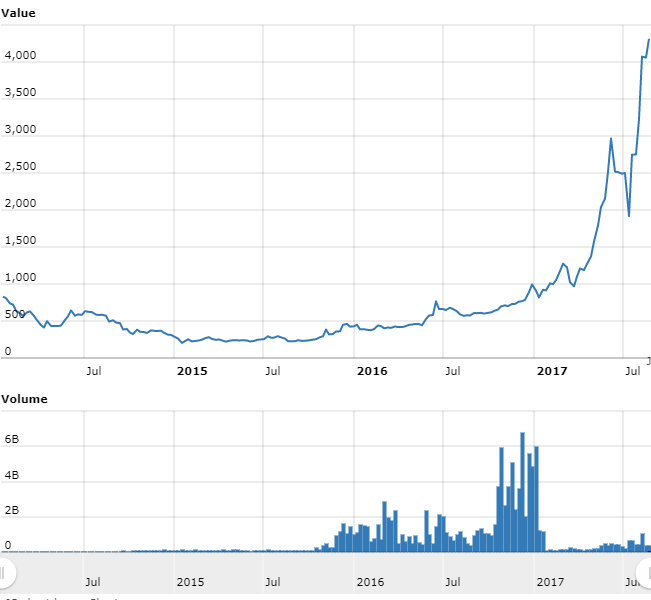
Source: Word Coin Index
Despite the astronomical growth most retail investors should not invest in crypocurrencies of any sort.
U.S. stocks have soared since the Global Financial Crisis (GFC) of 2008-09. The benchmark S&P 500 has more than doubled from the lows reached during the dark days of 2009 when it seemed like world was coming to end. However none of the markets in developed Europe have had a strong recovery since the GFC like the US markets. One of the reasons for their dismal performance is dithering by policy makers and politicians. While the US took swift action to shore up banks with programs like TARP Europeans were slow to take action as a result of political fights and analysis paralysis. Multiple hits of sovereign debt crises in countries such as Greece did not help European markets also.
The chart below shows the wide gap in returns between S&P 500 and FTSE 100 returns since the GFC:
Click to enlarge
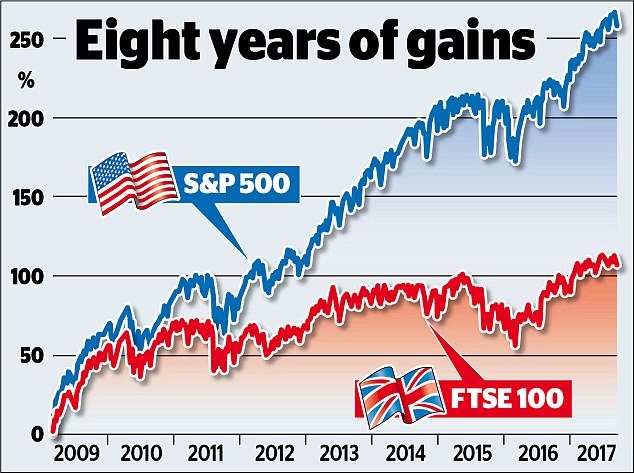
Source: Are global stock markets heading for a crash? With US shares expensive and rates set to rise, fund managers fear we could be due a correction, This is Money, UK
On a year-to-date basis the FTSE 100 is up only 3.6% while the S&P has increased a decent 9.12% based on price appreciation only.
The average stock holding period for developed markets has been on the decline for many years now. For example, by one estimate the average holding for stocks listed on the NYSE is just 7 months or less than 2 years by another estimate.
In emerging markets(EM) also, the average holding periods are very low. EM investors also have short-term investment horizons and tend to be very impatient as the chart shows below:
Click to enlarge
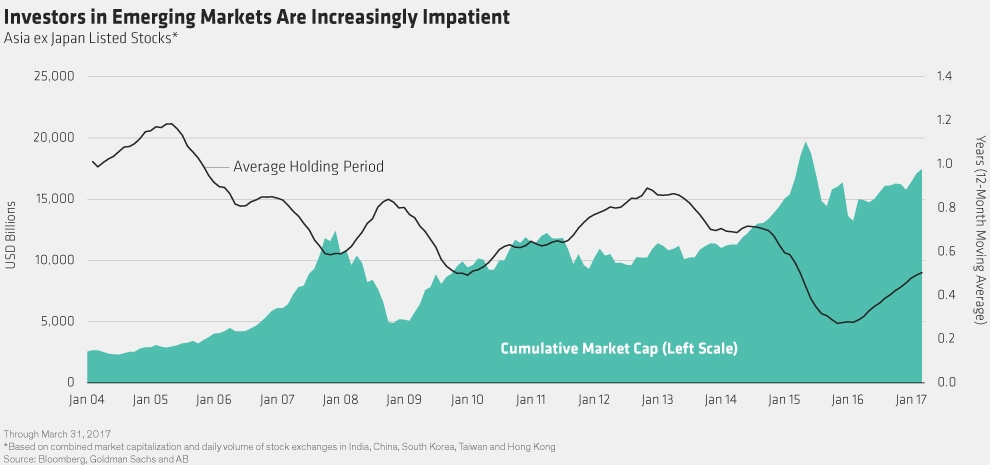
Source: Patience Pays in Emerging Equities, Alliance Bernstein blog
As with developed markets, low holding periods in emerging markets is bad for investors. Since stocks in developing countries are even more volatile than their developed world peers, holding stocks for short duration is an unwise strategy.
Also see: Duration of Stock Holding Periods Continue to Fall Globally, TFS
In a post earlier this month I wrote about the Four Classic Bubbles of the Past. The chart below shows the four major global asset bubbles in the past four decades:
Click to enlarge
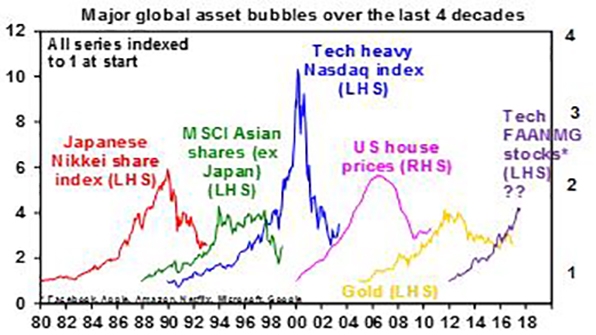
Source: The Global Financial Crisis 10 years on- Lessons learned and can it happen again?, Dr Shane Oliver, AMP Capital
The current explosive stock price rise in web stocks like Facebook(FB), Amazon(AMZN), Alphabet(GOOG), etc. are nowhere near the dot com levels seen in late 1990s according to Dr.Shane.
Disclosure: No postitions