Defining a bubble in equity markets is tricky. However according to Jeffrey Kleintop at Schwab a bubble is defined as a rise of 1,000% or 10 times over 10 years. The chart below shows four bubbles from the past. While today some tech stocks are all the rage and the NASDAQ has reached record levels, one of the worst bubbles in recent memory was the NASDAQ bubble that led to billions of dollars in losses to investors when it popped after the dot-com boom.
Click to enlarge
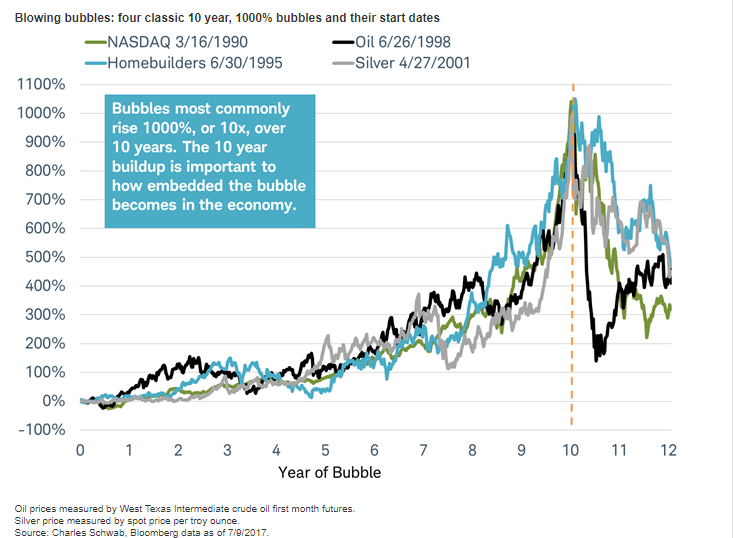
Source: Where’s the Next Bubble?, by Jeffrey Kleintop, Schwab


