The top five best and worst performing and emerging equity markets from 2003 to 2022 are shown in the chart below. In 2022, Turkey was the best performer as the country recovered from economic and currency crisis. Chile came in at second followed by Brazil. From 2003, we can observer at least one country from Latin America appears almost every year with the top returns among emerging markets.
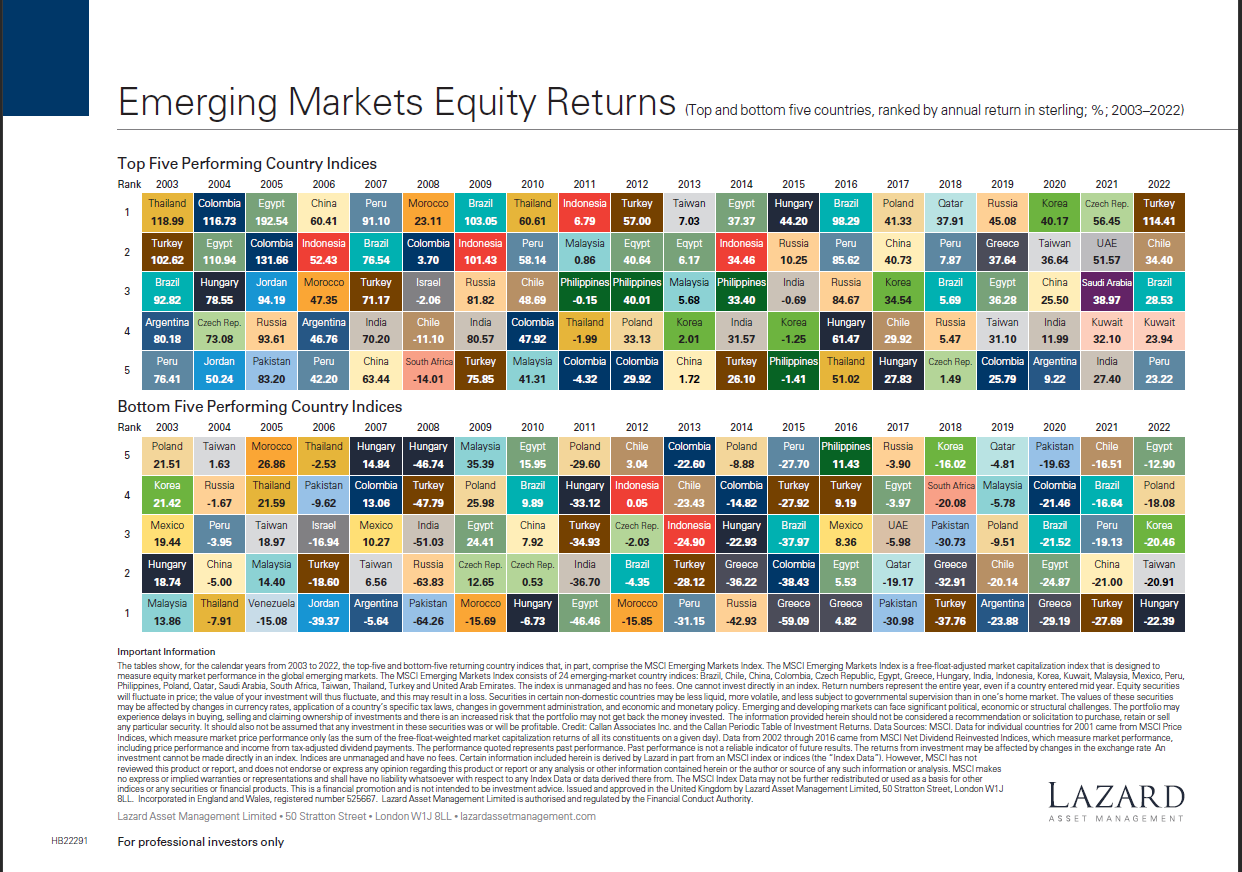
Note: The returns shown above are in British Pound Sterling
Data Sources: MSCI. Data for individual countries from 2003 through 2022 came from MSCI Price Indices, which measure market price performance only.
Source: Lazard Asset Management
Related ETFs:
- iShares MSCI South Korea ETF (EWY)
- iShares MSCI Taiwan ETF (EWT)
- iShares MSCI India ETF (INDA)
- iShares MSCI Emerging Markets ETF (EEM)
- Vanguard MSCI Emerging Markets ETF (VWO)
Disclosure: No Positions