Largest Declines and Annual Returns of Global Stocks

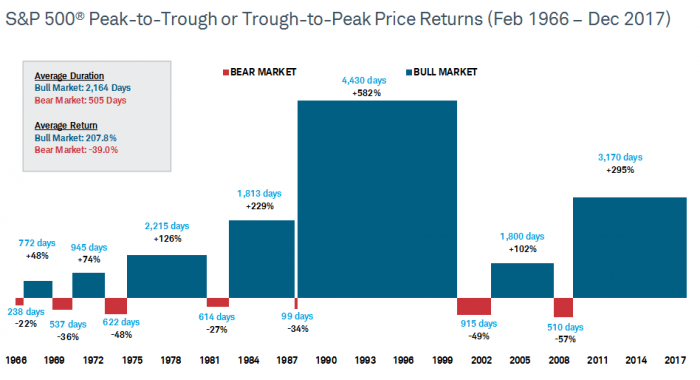
Pullbacks are common in equity markets. In any given years stocks tend to go up and down for any number of random reasons. Just because stocks have had declines in a year does not mean they will have a negative return for that year. Even when stocks have had big declines they have soared back to yield positive returns for the year.

From a recent article at Charles Schwab:

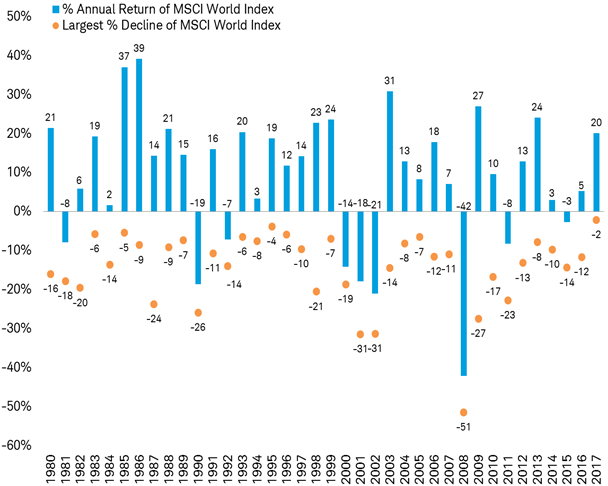
It isn’t unusual to see pullbacks. The peak-to-trough drawdown in global stocks so far this year, at about 8%, is only about half of the average annual pullback of the past 37 years. That could mean there is more to come, either for the current pullback or additional pullbacks over the course of the year. Global stocks have fallen from peak-to-trough by more than 10% in two-thirds of the years since 1979; yet most of those times still posted a gain for the year, as you can see in the chart below.

Declines are common and usually don’t mean losses for the year

S&P 500: Bear and Bull Market Price Returns

Volatility is back in the equity markets with a vengeance. After years of calm and rising markets even a small decline of 2-3% feels like a major fall. Some investors may wonder if we are heading towards a bear market. Even if a corrections turns into a bear market, bear markets usually do not last too long according to research by Schwab. Their research showed that the average bear market last just over a year (505 days). The longest bear market lasted about two and half years but then it was followed by a five year bull market. The data sample used for the study was S&P 500 price returns going back to 1966.

The following chart shows the bear and bull market returns for the S&P 500:

Click to enlarge

Source: Schwab Center for Financial Research with data provided by Bloomberg. The market is represented by daily price returns of the S&P 500® Index. Bear markets are defined as periods with cumulative declines of at least 20% from the previous peak close. Its duration is measured as the number of days from the previous peak close to the lowest close reached after it has fallen at least 20%. In the chart, periods between bear markets are designated as bull markets.  Indices are unmanaged, do not incur fees or expenses, and cannot be invested in directly. Past performance does not guarantee future results.

Source: Volatile Markets: Here’s What You Should Know, Schwab, Feb 9, 2018

The key takeaway is that it is impossible to time the markets. The easiest way to handle the bear is to focus on the long-term and not panic with short-term declines. Over a course of holding stocks for a few decades a long-term investor will invariably face a few bear markets.

Jason Zweig: Investing in Stocks Requires Courage and Patience

In his latest column, Jason Zweig, one of my favorite financial author writes about the need for patience and strong stomachs when markets turn volatile like it did in the past weeks. Using his personal experience during the financial crisis of 2008-09 he gives some valuable advice for long-term investors.

From the article:

To paraphrase the boxer Mike Tyson, investors always have a plan until the market punches them in the face.

After U.S. stocks dropped roughly 10% in ten trading days, it’s more important than ever for individuals to understand what it means, and what it takes, to be a long-term investor.

There was a lot of crowing this past Tuesday when the S&P 500 rose nearly 2% after a 4.1% drop on Monday. Cries of “buy on the dip” rang throughout the land.

Buying on the dip, when stocks go down a few percentage points, isn’t so hard. Can you keep buying, or even merely hold on, if stocks go down 50% or more? That’s the question I’ve been asking myself this past week — not because I believe that’s about to happen, but because I know it can.

The best way to answer that question is to look back at what you did in 2008 and 2009, if you were investing then.

I did just that last night, poring through my old account records online to check whether my memory is accurate. Humans have a remarkable ability to make rearview mirrors out of rose-colored glass. So I wasn’t sure whether my recollection of buying more stocks throughout 2008 and early 2009, as the market kept dropping in nauseating swoops, was just a myth I’d been telling myself.

It turned out that between the market’s peak on Oct. 9, 2007 and its bottom on March 9, 2009, I repeatedly, almost obsessively, pumped any idle cash into stocks.

Source: When Investing in Stocks Makes You Feel Like Throwing Up and You Do It Anyway, WSJ, Feb 9, 2018

The entire article is worth a read.

Dividend Withholding Tax Rates by Country for 2018

The withholding tax rates for dividends by country has been updated by S&P Dow Jones for 2018. This is a simple and quick reference table to identify the withholding tax rate for a country.

Click to enlarge

Source: S&P Dow Jones Indices

Download: Dividend Withholding Tax Rates by Country for 2018 (in pdf)

Related: