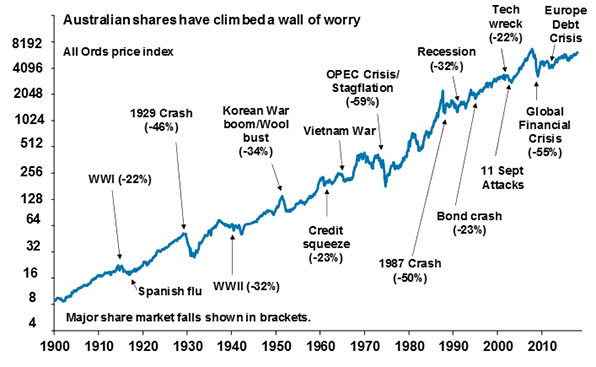
Emerging markets also tend to bounce back sharply after major market declines. This phenomenon is similar to developed markets where dramatic falls are followed by strong recoveries in the following months and years.
The table below shows some large emerging market crashes and the ensuing rebounds:
Click to enlarge
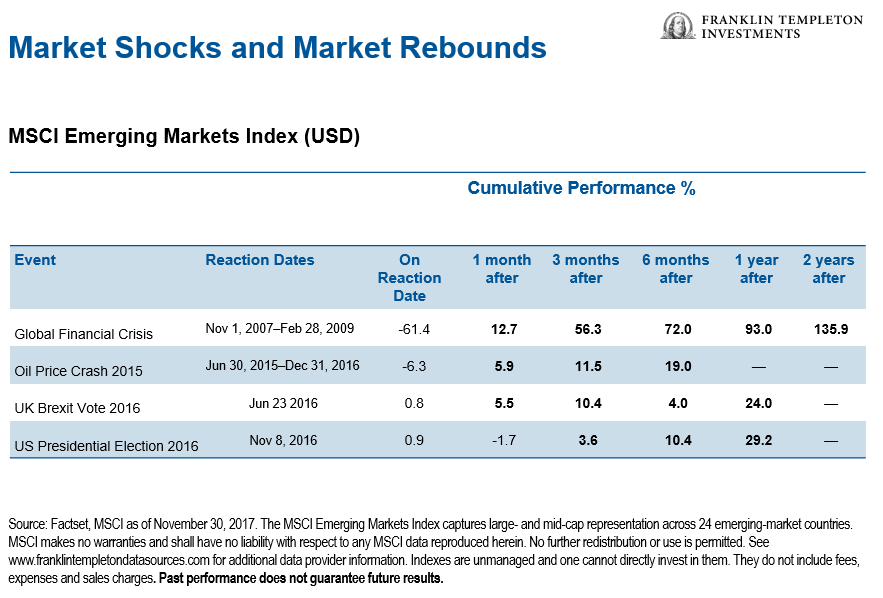
Source: Emerging-Market Resilience, Franklin Templeton
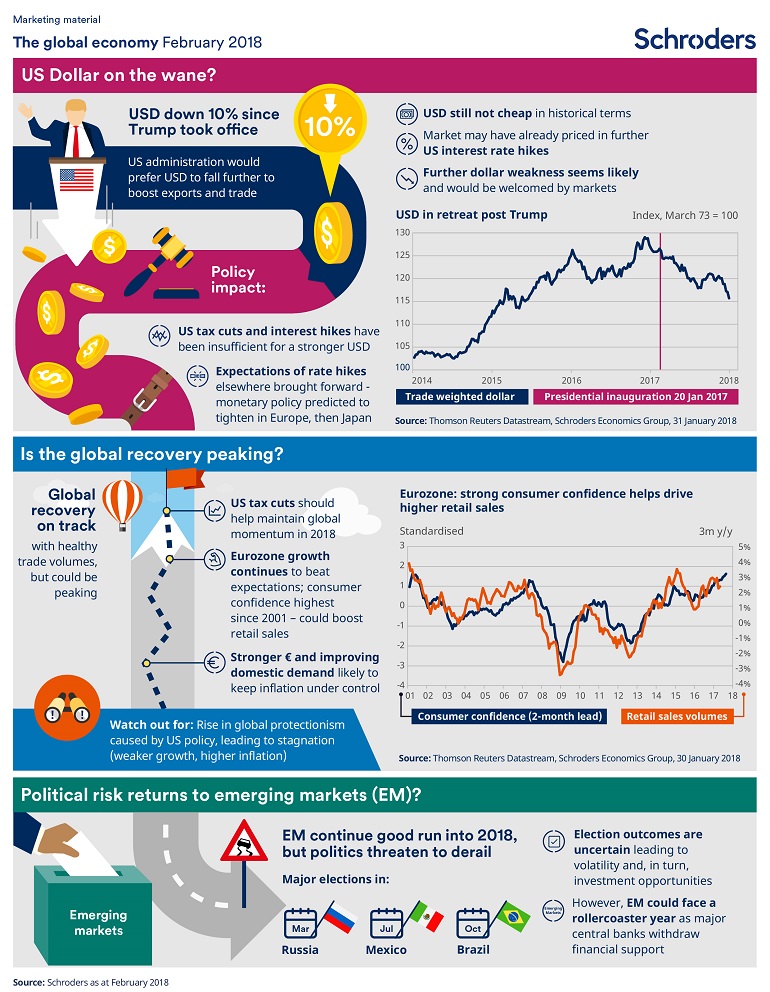
Emerging markets are not prone to declines not only due to local issues but also due to global events. For example, rising US interest rates can adversely affect emerging market stocks.
Though EM stocks got crushed during the Global Financial Crisis of 2008-09 they soared back like a rocket to gain over 135% in two years.
Related ETFs:
Disclosure: No Positions