S&P 500 Revenue Exposure by Country

The S&P 500 Index is the benchmark index of the US equity market. Billions of dollars are invested in various products tracking the index.

The sector breakdown of the S&P 500 is shown below:

Click to enlarge

Source: S&P Indices

The tech sector dominates the US equity market. No other country in the world can match the technical innovation and power of the Silicon Valley. From Alphabet(GOOG) to Facebook(FB) to Amazon(AMZN) and other firms in between all the top tech firms are located in the US. Even developed European are unable to compete against American firms in the tech sector. That is why there is no European Google or European Facebook for example.

Many of the large-cap US firms are multi-national firms with huge operations in foreign countries. Hence the revenue exposure of S&P 500 firms to overseas markets is high.

The following chart shows the revenue exposure of S&P Revenue Exposure by Country:
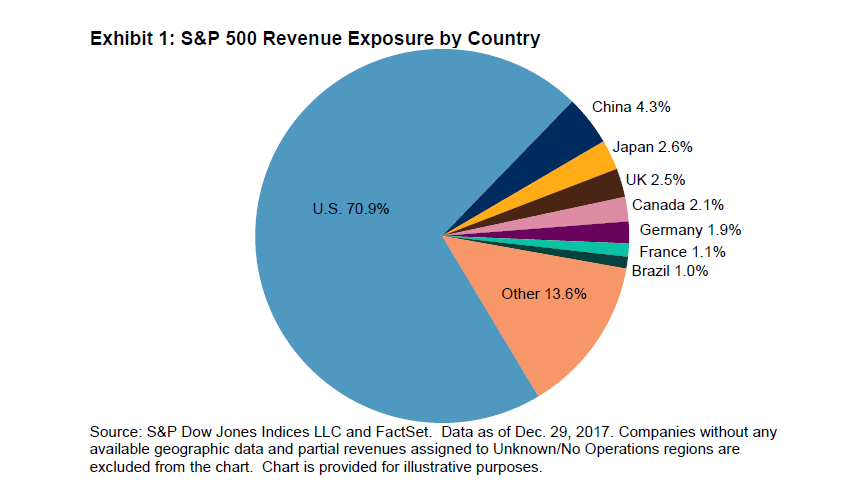
Source: The Impact of the Global Economy on the S&P 500 by Phillip Brzenk, S&P Global

The US is the main market for S&P 500 firms accounting for 71% of their revenues. The remaining revenue come from foreign countries. China, Japan and the UK are top three countries in terms of revenue exposure. Though Mexico has large trade ties to the US, it does not appear in the top revenue exposure countries.

Which S&P 500 sectors have the most and least exposure to foreign countries?

The tech and materials sector have the highest revenue to overseas markets. Companies such as Intel(INTC), Alphabet(GOOG), etc. dominate in the global tech space. Similarly material firms such as miners and oil producers have large operations overseas.

The sectors with the least revenue exposure to foreign markets are the real estate, telecom and utilities. So the performance of companies in these sectors mostly depend on the health of the US economy than the economy of other countries.

Related ETF:

  • SPDR S&P 500 ETF (SPY)

Disclosure: No Positions

See also:

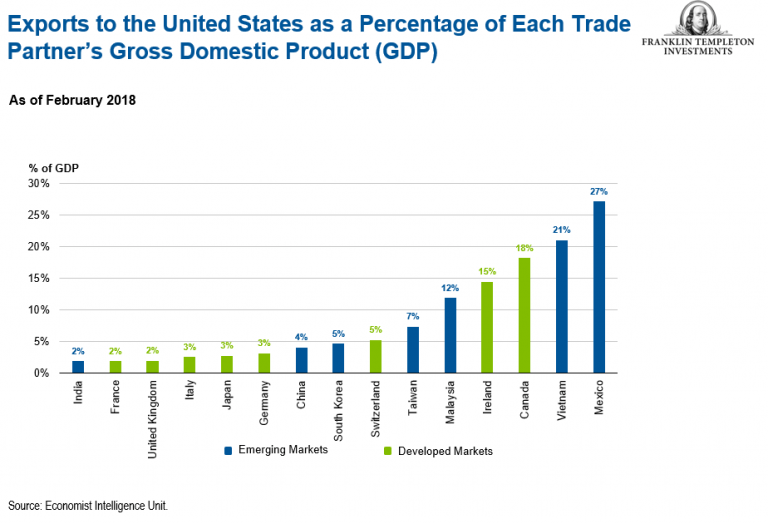
Exports to the US as a Percentage of Each Trade Partner’s GDP: Chart

The top five trading partners of the US are China, Canada, Mexico, Japan and Mexico in the order noted. Canada and Mexico are top trade partners due to their proximity to the US and also being members of the NAFTA.

China tops all countries in trading goods with the US. However the US runs a trade deficit with the country – meaning the US imports more from China than it exports to China. The year-to-date trade deficit with China is 65% according to the Census Bureau.

Click to enlarge

Source: Emerging Markets Experience a Volatile First Quarter, Franklin Templeton Investments

Though the US runs a trade deficit with China, from a Chinese perspective the large amount of goods exported to the US still has a small impact on the GDP. Or to put it another way, the total exports to the US account for only 4% of China’s GDP. So the Chinese economy is more dependent on the domestic market and other countries. Hence the trade tariff that Trump slapped on China will not have a major impact on the Chinese economy.

However Mexico’s economy is highly dependent on the US. Exports to the US account for 27% of Mexico’s GDP. Similarly the Canadian economy is also dependent on the health of the American economy.

Revenue Exposure Of Australia S&P/ASX 200 Index

The S&P/ASX 200 is one of the main benchmark index of the Australian equity market. The index is comprised of 200 largest firms by float-adjusted market capitalization.

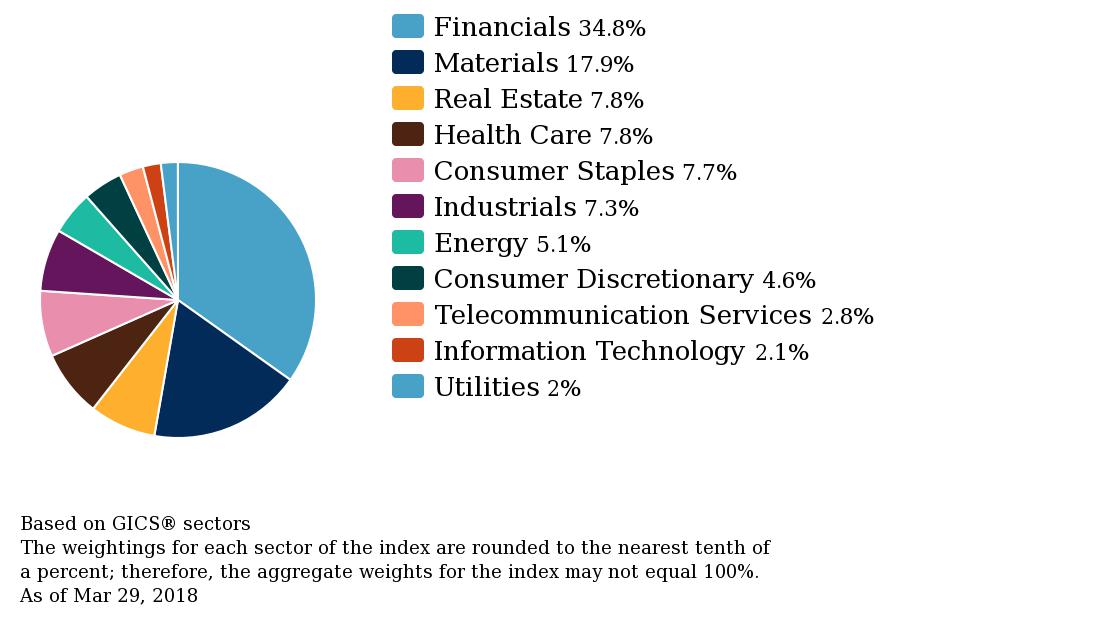
From a sector allocation perspective, over half of the index is made up of financials and materials as shown in the chart below:

Click to enlarge

Source: S&P Indices

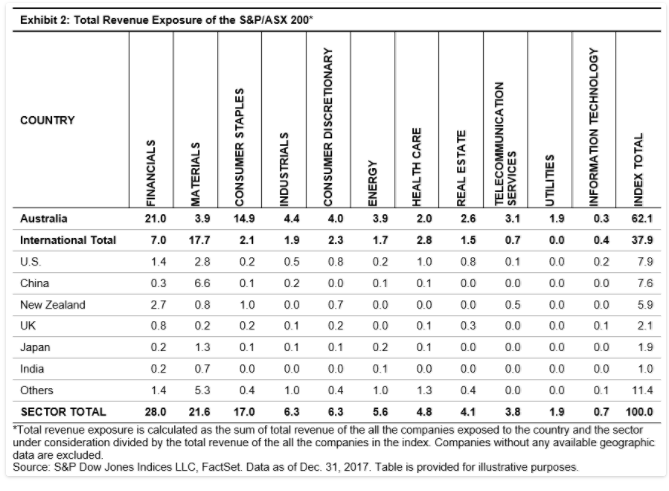
The following table shows the revenue exposure breakdown of the S&P/ASX 200 companies:

Click to enlarge

Source: Revenue Exposure of the S&P/ASX 200 by Utkarsh Agrawal, Indexology Blog

A few observations:

  • About 40% of the index’s revenue come from foreign markets.
  • The highest revenue exposure is to the US, China and New Zealand.
  • Not surprisingly the material sector has the most exposure to foreign countries (18%). For example, most of the coal and iron ore mined in the country are exported to China and other countries.

The key takeaway for investors in Australian stocks is that economic conditions of foreign countries will have an impact of the performance of Australian firms. This is especially true with companies in the material sector where a booming demand for commodities overseas will determine the earnings of Aussie mining firms than the economy of the domestic market.

Related ETF:

  • iShares MSCI Australia Index Fund (EWA)

Disclosure: No Positions

Also seeThe Components of the S&P/ASX 200 Index

55 Leading Mining and Oil Stocks in Australia

Australia is a commodity-based economy similar to Canada. Some of the major exports of Australia are coal, iron ore, agricultural products such as wheat and wool and natural gas. Accordingly the Australian equity market is dominated by mining and oil companies in addition to financials. Other than financials, investors looking for Aussie exposure may have to consider some of the miners and resource firms.

The following list of 55 leading Australian mining and oil stocks can be used as a starting point for further researching opportunities in those sectors:

S.No.Company Name
1Altura Min
2Alumina
3Ausdrill
4AWE
5Beach Energy
6BHP
7BlueScope Steel
8Caltex Aust
9Champion Iron
10Cooper Energy
11Dacian Gold
12Evolution Min
13Fortescue Metals Grp
14Galaxy Res
15Global Geoscience
16Gold Road Res
17Iluka Res
18Independence Grp
19Kidman Res
20Lynas
21Macmahon
22Metals X
23Mineral Resources
24NEW Century Res
25New Hope Corp
26Newcrest Min
27Northern Star
28OceanaGold Corp
29Oil Search
30OM Hldgs
31Origin Energy
32Orocobre
33OZ Min
34Perseus Min
35Pilbara Min
36Regis Res
37Resolute Min
38Rio Tinto
39Sandfire Res
40Santos
41Saracen Min
42Senex Energy
43Sims Metal Mgmt
44WH Soul Pattinson
45South32
46St Barbara
47Syrah Res
48Western Areas
49Westgold Res
50Whitehaven Coal
51Woodside Pet
52WorleyParsons
53Yancoal Aust
54Z Energy
55Zimplats Hldgs

Source: AFR

Some of the above firms trade on the OTC markets in the US. The complete list of Australian ADRs is listed here.

Download:

Disclosure: No Positions

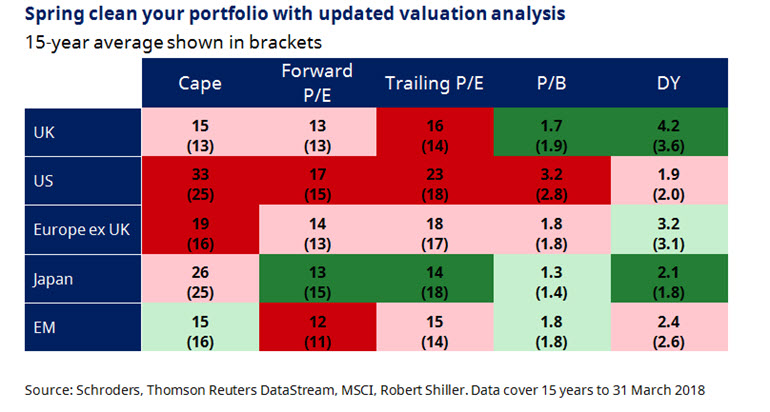
Equity Market Valuations: Which Markets Are Cheap Now?

US stocks continue to remain expensive relative to other markets according to a recent article posted at Schroders. Going into 2018, US equities were expensive based on multiple metrics. So even after the decline and volatility in the first quarter of this year, valuations are not in favor of American stocks.

Click to enlarge

Source: Which stockmarkets look cheap after the torrid start to 2018?, by Duncan Lamont, Schroders

From a overall valuation perspective emerging markets are relatively attractive than developed markets.

Related ETFs:

  • iShares MSCI Emerging Markets ETF (EEM)
  • Vanguard MSCI Emerging Markets ETF (VWO)

Disclosure: No Positions