A Note on the Collpase of Zimbabwe Stock Market

The Zimbabwe Stock Market fell 98% in one week and was shut down during the hyperinflation years of former dictator Mugabe. This is a shocking fact that some investors may not know.

Below is a short excerpt from an article at Research Affiliates:

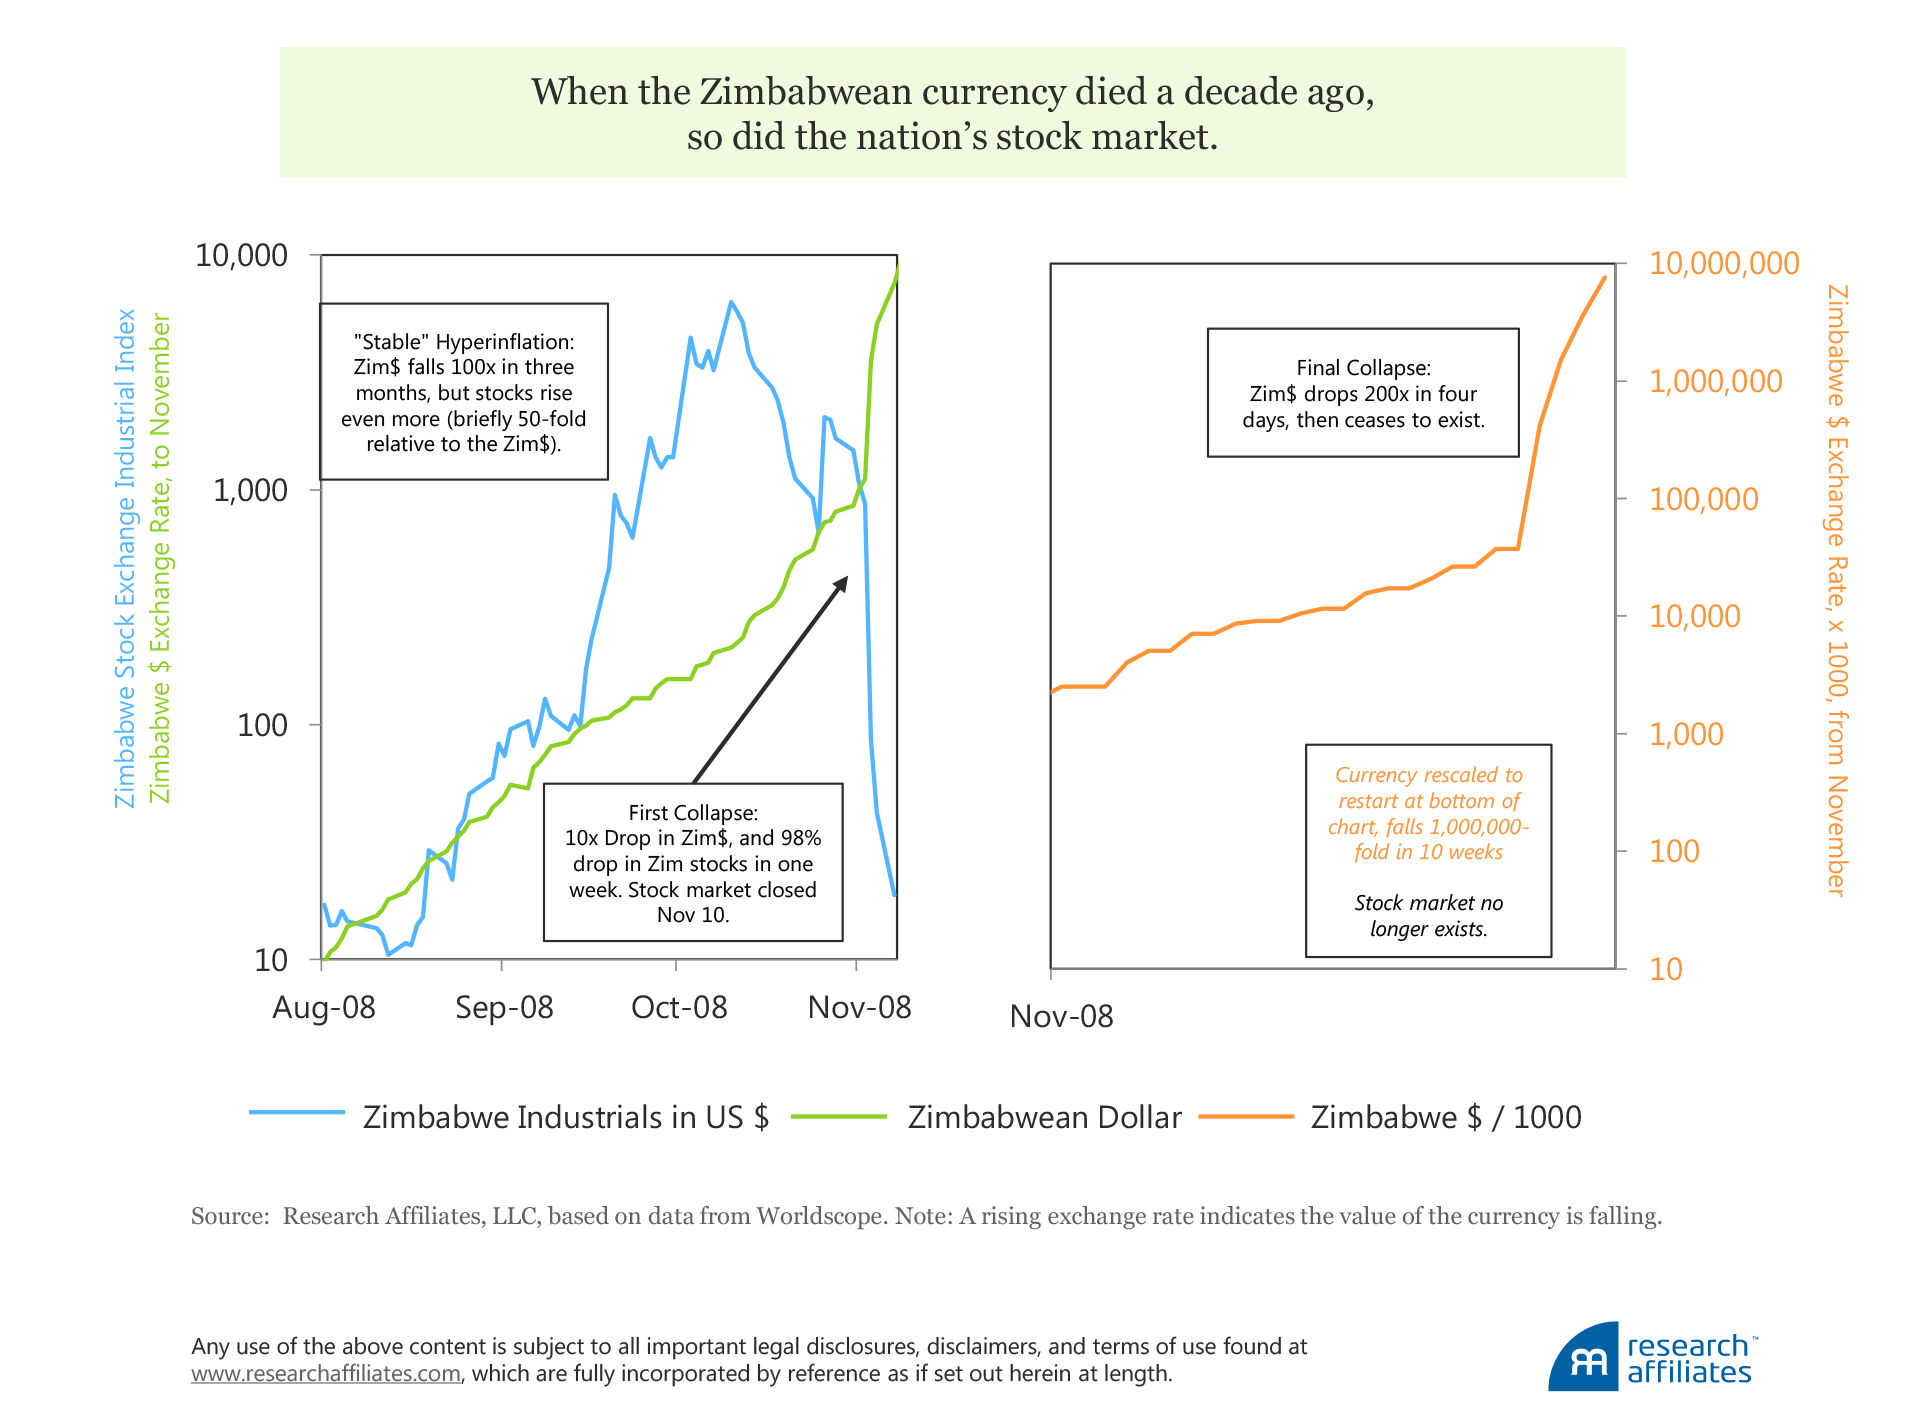
During the three months August–October 2008, the Zimbabwean dollar plunged from 10 to 1000 per the US dollar, a 100-fold currency collapse. At first, the Zimbabwean stock market was unfazed, rising 500-fold in just eight weeks, while the currency fell 10-fold. Thus, in US dollar terms, the stock market rose an astounding 50-fold over those eight weeks. In the next two weeks, however, the stock market toppled 85% and the currency tumbled another 3-fold. Adjusted for the plummeting Zimbabwean currency, the nation’s stock market plunged 95% in two weeks.

Then, both the currency and the stock market ratcheted up volatility another order of magnitude. When the hyperinflation went into overdrive, with purchasing power falling 90% in less than a week, the stock market fell 98% (99.8%, in US dollar terms) in that same week. The stock market in Zimbabwe then ceased to exist.

Suppose we had the clairvoyance to know the market was going to fall 99% in US dollar terms over that three-month period in 2008. And suppose we could have sold the Zimbabwean market short. The strategy would seem to be a no-lose proposition. But not so fast. Even with the prescience of knowing the market was going to zero in three months, by selling short we would have lost 50 times our money, with high odds of bankruptcy, even though we were eventually proven correct!

Whereas a bubble is not as hard to identify in real time as is commonly perceived, transforming a bubble into profit, even for investors who correctly discern it, is a tremendous challenge because late-stage bubbles can take valuations into the stratosphere.
 

Source: Yes. It’s a Bubble. So What?, Research Affiliates

Der Spiegel Cover: Trump Gives The Middle Finger To Europe

President Trump recently pulled the US out of the Iran deal bringing fresh confrontation with the middle east country. Many European countries against this unilateral action. However Trump has pulled off the deal simply ignoring the Europeans, most of whom are allies. Some political pundits also note that US image has also been burnished with this action as other countries now realize America no longer keeps its words.

The latest edition of Der Spiegel has the following cover figuratively depicting the actions of the US:

Click to enlarge

Source: Trump and Iran – Time for Europe to Join the Resistance, Der Spiegel

Interested readers may want to read the entire article linked above.

Manufacturing Labor Costs in Mexico vs. China

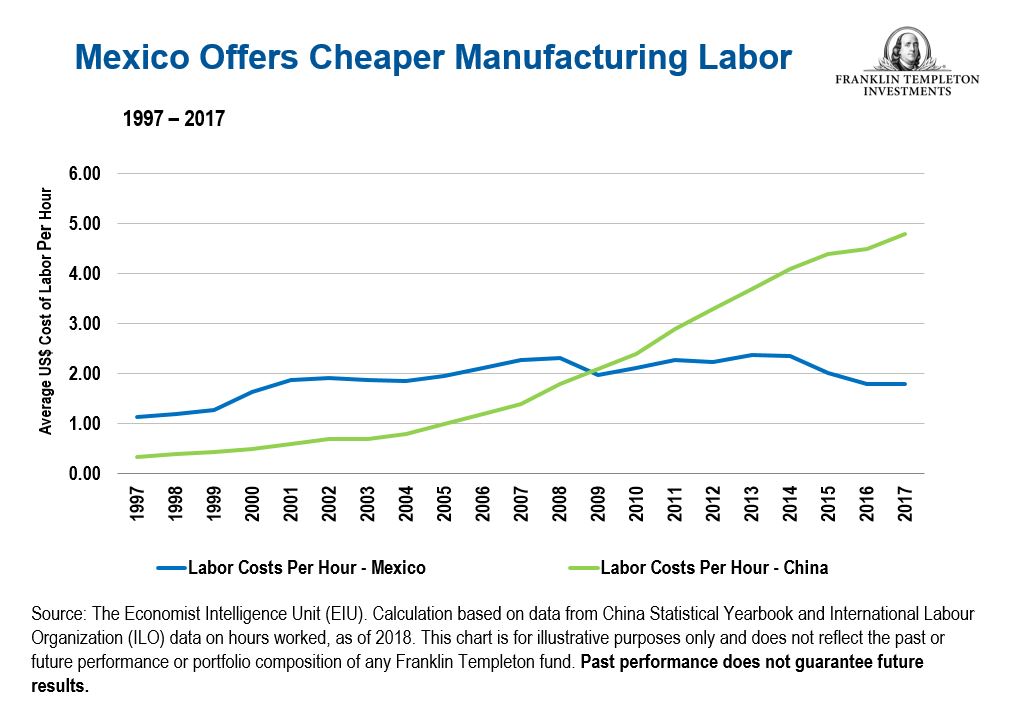
Labor costs in the manufacturing sector is cheaper in Mexico than other countries especially China. Major US firms have significant operations in the country due to the geographical proximity to the US and abundant and well-experienced workforce. I have written about the cost competitiveness of the Mexican labor market in the past before which you can see here and here and here. In the automotive industry, Mexican labor rate was $3.29/hr compared to $5.19/hr in China according to an article in The Wall Street Journal last year.

Manufacturing labor costs used to be cheaper in China before. That is not the case anymore as wages have continued to rise. For instance, Chinese labor costs were cheaper than Mexico up until 2009. Since then while Mexican labor rate has stagnated or slightly went down, China’s rates have consistently increased every year. The gap in rates between these two countries has become large with the average labor rate in Mexico remaining under $2/hr in 2017 relative to nearly $5/hr in China as shown in the chart below:

Click to enlarge

Source: Further Reforms Could Lead Latin American Economies to Become Bigger Growth Players, Franklin Templeton Investments

Political and economic reforms may get a boost with a general election coming up in Mexico in July this year. So from an investment standpoint, investors may want to keep an eye on Mexican stocks and look for potential opportunities. In general, investors need to focus more on Mexican equity market than China.

Update(12/14/20):

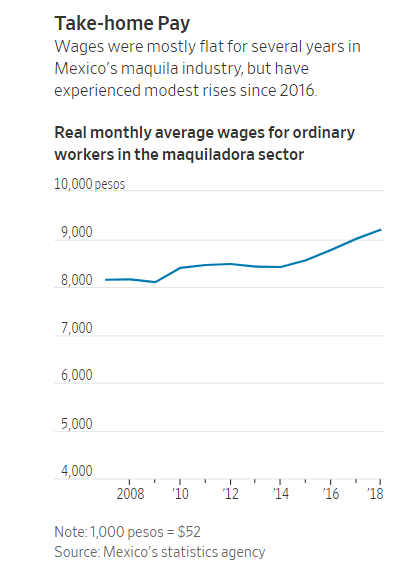
Monthly wages for Mexico Maquila Workers since 2007:

Click to enlarge

Source: Labor Lawyer Takes On Mexico’s Exporters, Wins Higher Wages, WSJ

Update (12/14/20):

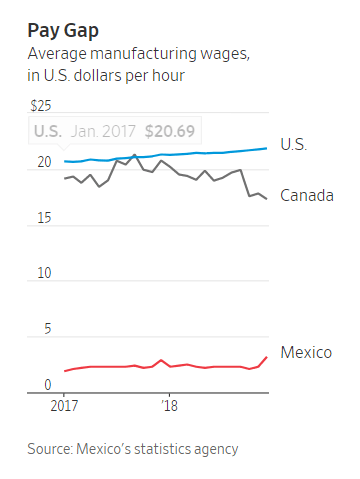
1.Average Manufacturing Wages – US vs. Canada vs. Mexico:

Source: Mexican Lawmakers Approve Pro-Labor Changes, WSJ.com, April 11, 2019

2. In 2018 IHS Markit estimates the average automotive manufacturing wage in Mexico was roughly US$4.15 (80 pesos) per hour.

Source: IHS Markit

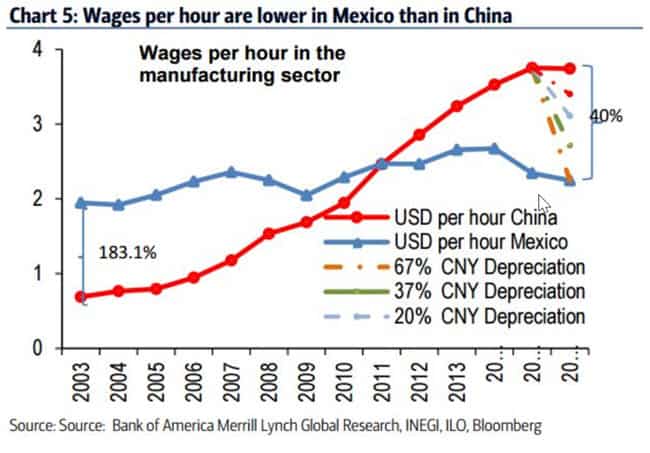
3.”When looking at China vs. Mexico manufacturing, labor rates in Mexico are now, in many cases, lower than China. In constant dollar terms, hourly manufacturing wages are lower than those in China. Mexico also offers much steadier wages, making it easier for companies to forecast manufacturing costs. As of 2019, the fully burdened direct laborer wage rate in Mexico is about $3.95 per hour vs. $4.50 per hour in China.

Foreign exchange rates also favor Mexico vs. China, being that the Peso has steadily declined against the U.S. Dollar over the past 30 years. Meanwhile, the Chinese Yuan has mostly been pegged to the U.S. Dollar. In fact, the devaluation of the Peso vs. the U.S. Dollar has reduced the effective labor rate inflation to about 3% per year.  ”

Source: NAPSintl.com

4.Labor Costs-Mexico vs China:

Source: TECMA

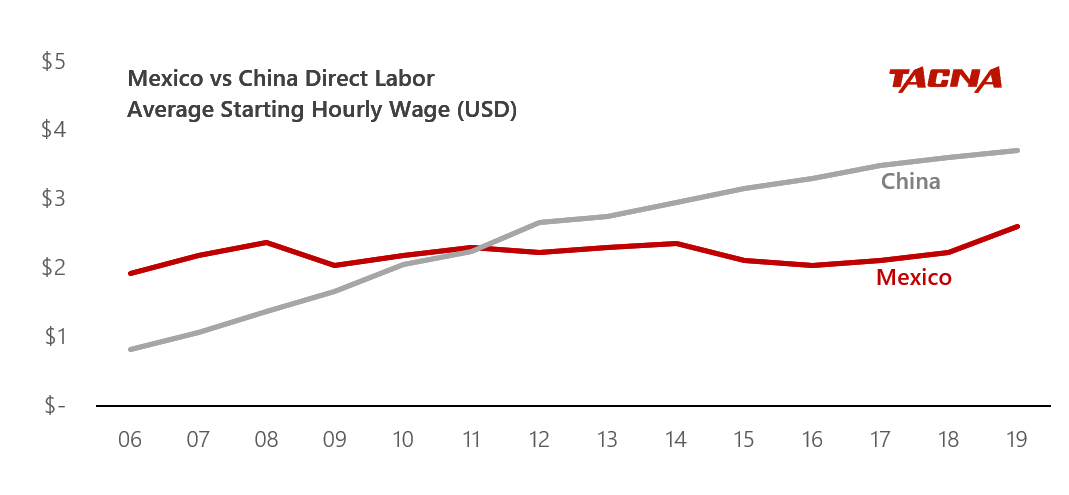
5.Mexico vs. China-Direct Labor Hourly Wage Chart:

Source: TACNA

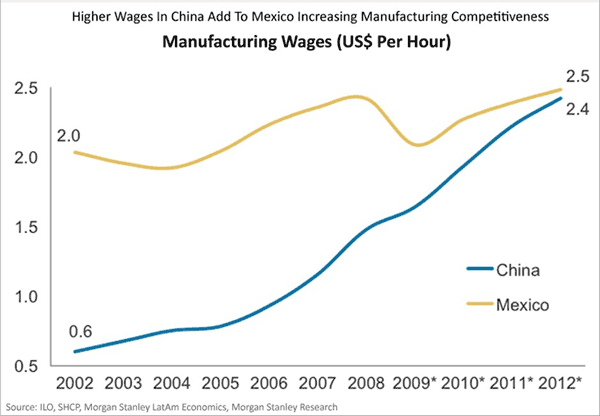
6.China vs. Mexico Wages – Chart:


Source: Supply Chain Digest

Related:

On The Astonishing Growth Of Chinese Economy

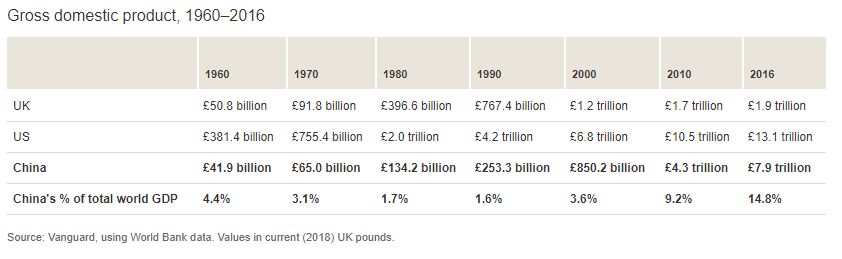
The economy of China has undergone an astonishing growth rate since the 1990s. For instance, China acocunt for just 1.6% of the world GDP. But by 2010, it jumped to 9.2% of the world total GDP. Rising further, China’s GDP reached about 15% of the global economy in 2016.

The table below shows the growth of China’s economy relative to the US, UK and the world:

Click to enlarge

Source:Why invest in China?, Vanguard UK

From the above article:

In 1960, the economy of the United Kingdom was almost 20% larger than that of China. In 2006 China’s GDP surpassed the UK’s, and by 2016 the Chinese economy was more than six times larger. Between 2000 and 2016, China’s share of total global GDP more than trebled, from 4% to 15%, putting it in second place, behind the United States, whose GDP share decreased from 40% to 25% in the same time frame.1

1 Vanguard, using data from World Bank.

The China Stock Market Has The Highest Turnover Ratio In The World

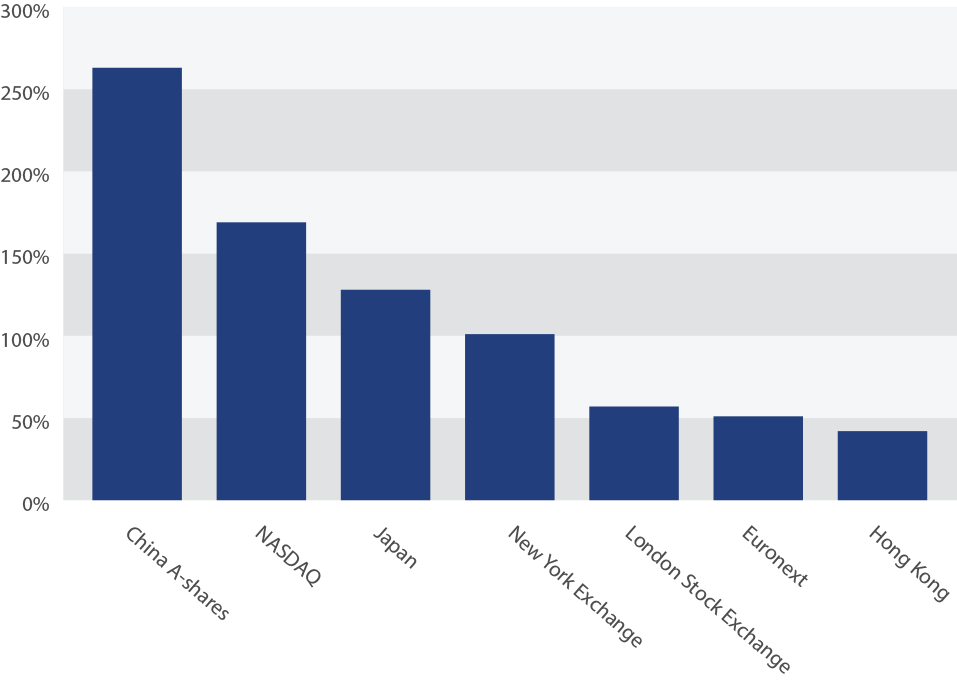
The stock turnover ratio is the highest in China. This is true especially with A-Shares which are for domestic investors and traded in the local currency. The B-Shares are bought by foreign investors and they cannot buy A-Shares. Unlike other markets such as the US where most investors tend to hold for the long-term, Chinese investors tend to be highly short-term oriented. From an article at Allianz Global Investors:

High turnover adds to A-share liquidity

Domestic retail investors in China dominate the market for A-shares and account for more than 80 per cent of daily turnover. With the investment culture in China focused more on momentum and short-term trading, the stock turnover ratio of China A-shares is among the highest in the world. High levels of turnover generally make it easier for investors to buy and sell shares.

China A-Shares Have a High Turnover Ratio


Source: Ten key facts about China A-shares, Allianz Global Investors

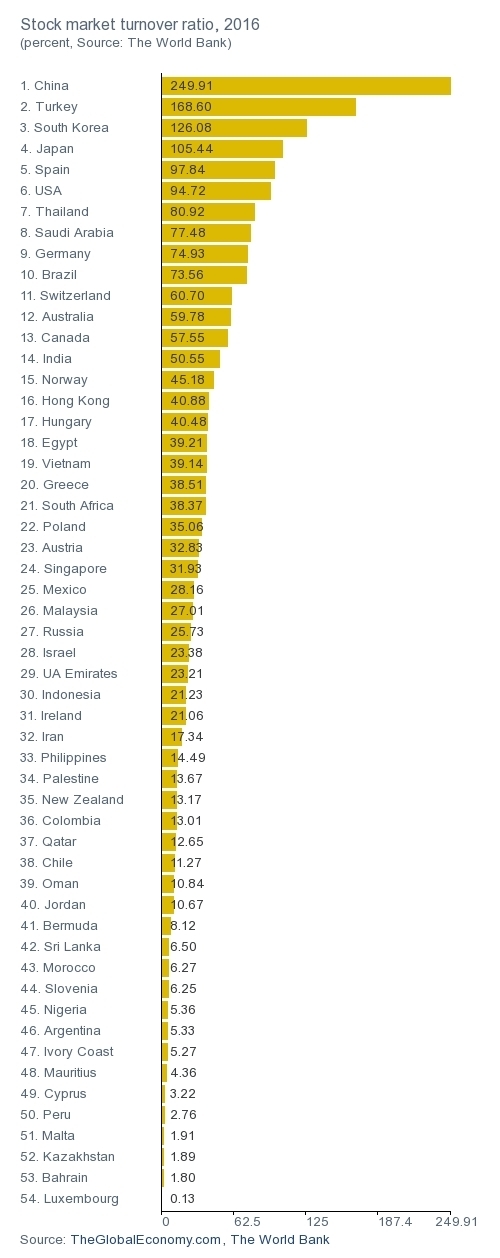
China also ranks the highest in terms of stock turnover ratio when compared to other countries as shown in the chart below:

Click to enlarge

Source: The Global Economy

The key takeaway is that because most investors are retail investors and not institutional investors in China’s A-Shares, the market is prone to wild swings. For example, in a down market retail investors tend to panic at a faster rate and also engage in extreme speculation in a rising market.