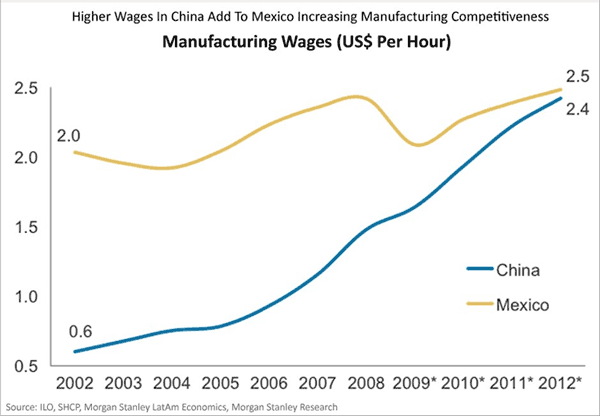
Labor costs in the manufacturing sector is cheaper in Mexico than other countries especially China. Major US firms have significant operations in the country due to the geographical proximity to the US and abundant and well-experienced workforce. I have written about the cost competitiveness of the Mexican labor market in the past before which you can see here and here and here. In the automotive industry, Mexican labor rate was $3.29/hr compared to $5.19/hr in China according to an article in The Wall Street Journal last year.
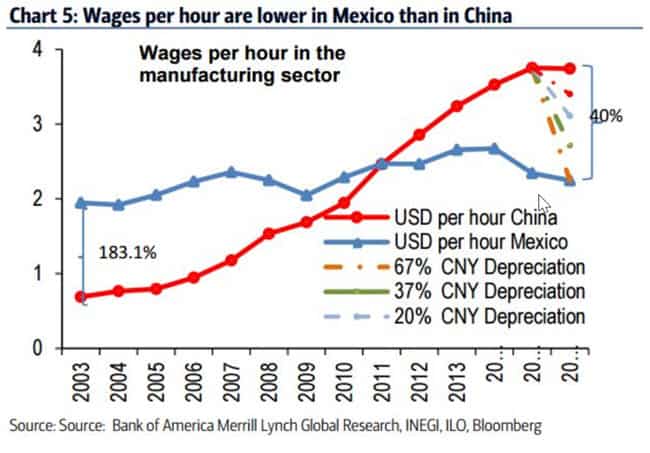
Manufacturing labor costs used to be cheaper in China before. That is not the case anymore as wages have continued to rise. For instance, Chinese labor costs were cheaper than Mexico up until 2009. Since then while Mexican labor rate has stagnated or slightly went down, China’s rates have consistently increased every year. The gap in rates between these two countries has become large with the average labor rate in Mexico remaining under $2/hr in 2017 relative to nearly $5/hr in China as shown in the chart below:
Click to enlarge
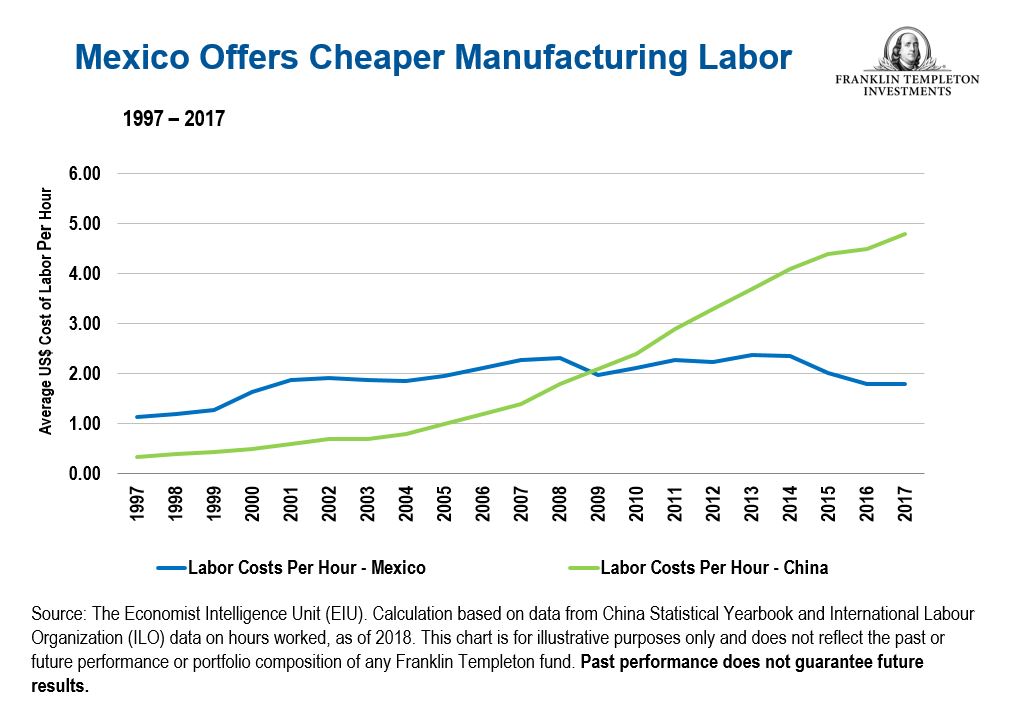
Source: Further Reforms Could Lead Latin American Economies to Become Bigger Growth Players, Franklin Templeton Investments
Political and economic reforms may get a boost with a general election coming up in Mexico in July this year. So from an investment standpoint, investors may want to keep an eye on Mexican stocks and look for potential opportunities. In general, investors need to focus more on Mexican equity market than China.
Update(12/14/20):
Monthly wages for Mexico Maquila Workers since 2007:
Click to enlarge
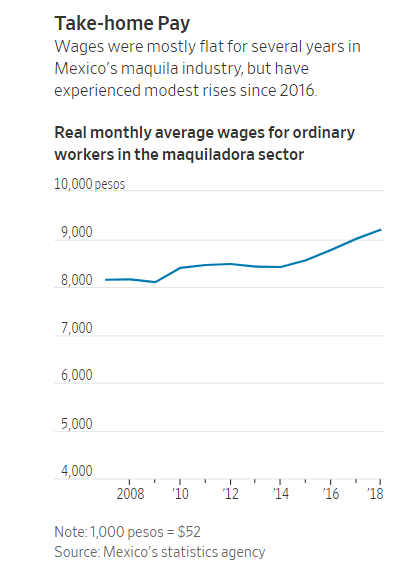
Source: Labor Lawyer Takes On Mexico’s Exporters, Wins Higher Wages, WSJ
Update (12/14/20):
1.Average Manufacturing Wages – US vs. Canada vs. Mexico:
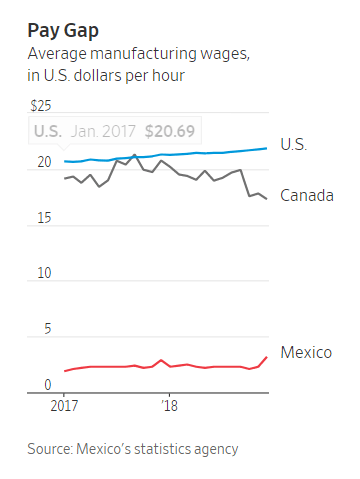
Source: Mexican Lawmakers Approve Pro-Labor Changes, WSJ.com, April 11, 2019
2. In 2018 IHS Markit estimates the average automotive manufacturing wage in Mexico was roughly US$4.15 (80 pesos) per hour.
Source: IHS Markit
3.”When looking at China vs. Mexico manufacturing, labor rates in Mexico are now, in many cases, lower than China. In constant dollar terms, hourly manufacturing wages are lower than those in China. Mexico also offers much steadier wages, making it easier for companies to forecast manufacturing costs. As of 2019, the fully burdened direct laborer wage rate in Mexico is about $3.95 per hour vs. $4.50 per hour in China.
Foreign exchange rates also favor Mexico vs. China, being that the Peso has steadily declined against the U.S. Dollar over the past 30 years. Meanwhile, the Chinese Yuan has mostly been pegged to the U.S. Dollar. In fact, the devaluation of the Peso vs. the U.S. Dollar has reduced the effective labor rate inflation to about 3% per year. ”
Source: NAPSintl.com
4.Labor Costs-Mexico vs China:
Source: TECMA
5.Mexico vs. China-Direct Labor Hourly Wage Chart:
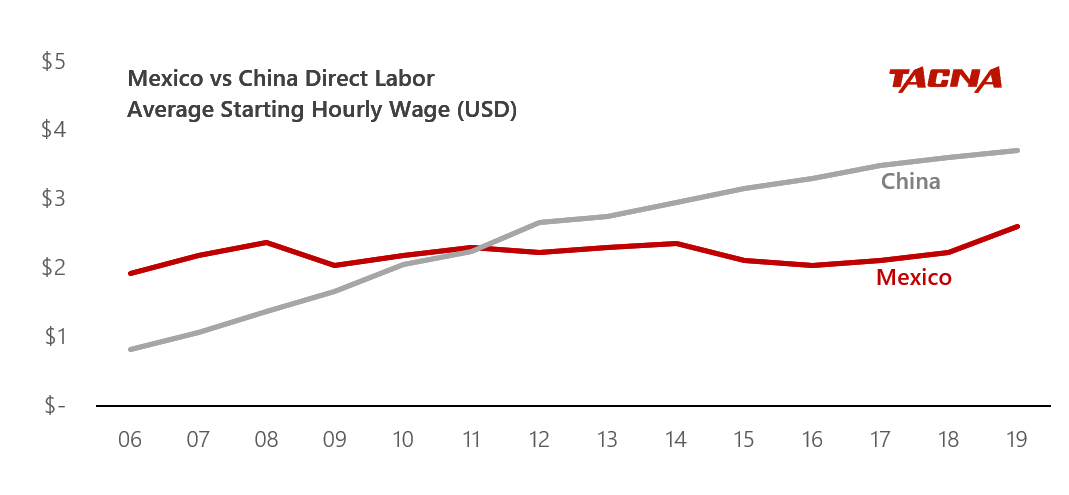
Source: TACNA
6.China vs. Mexico Wages – Chart:
Source: Supply Chain Digest
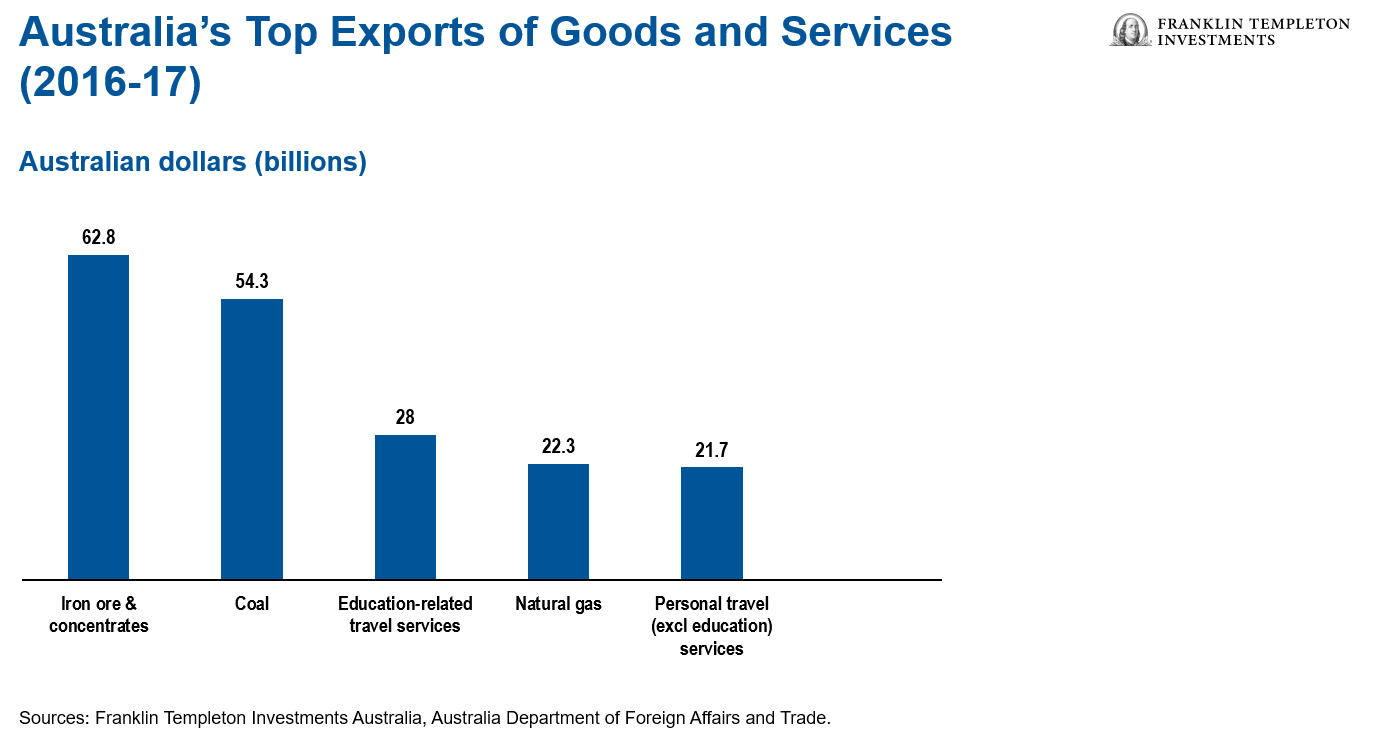
Related: