Bull and Bear Markets for UK Markets from 1946 to 2022: Chart

One of the topics that I have written about many times in the past is the importance of long-term investing. In the short term markets tend to be volatile for any number of reasons. Ignoring these volatilities and the noise that go with them is the key for success. Bull markets tend to be longer and stronger than bear markets. This is true not just with US markets but also with other developed markets as well. My posts on the bull and bear markets in the US can be found here and here. This concept applies to the Australian market as well as discussed here.

The UK equity markets follows a similar trajectory also as shown in the below chart from Vanguard. The bull and bear market in the UK market from 1946 to 2022:

Click to enlarge

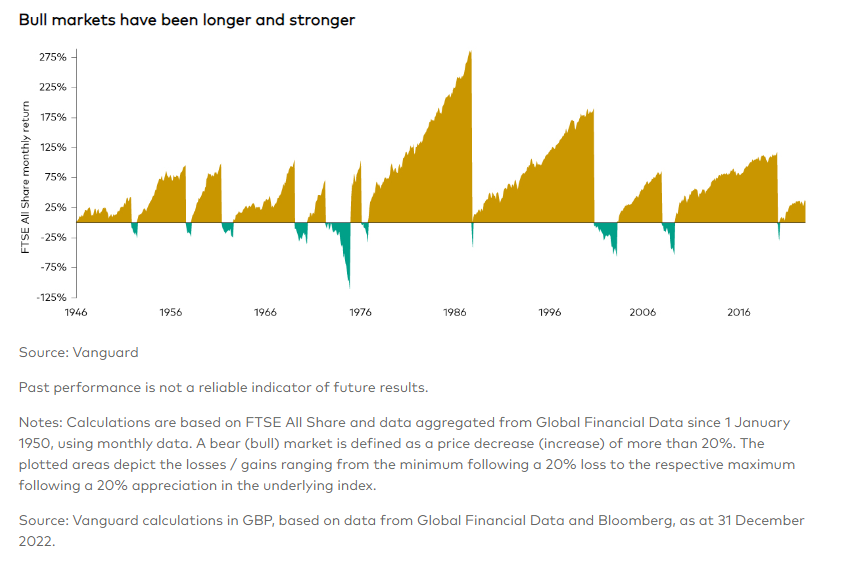
Source: Staying the course during market uncertainty by James Norton, Vanguard UK

An excerpt from the article:

Long-term perspective
It is also worth bearing in mind that while bear markets – defined as experiencing a fall of more than 20% in share prices – are indeed challenging, historically they have been short-lived in comparison to the longer-term growth that global stock markets have delivered.

The chart below shows that over the past 70 years, the average bull market – when share prices rise by 20% or more – has returned 120% and lasted around six and a half years. Meanwhile, the average bear market has lasted just over a year and returns have fallen 43%.

He also noted the following:

“If you miss the bad days, the chances are you’ll miss the good ones as well.”

This is absolutely true indeed regardless of which developed market an investor invests in.

Related ETF:

  • iShares MSCI UK ETF (EWU)

Disclosure: No Positions

High Losses Require Even Higher Gain To Break Even: Chart

The US equity market has been up strongly almost every year for the past few years. While gains are nice it is also important to remember that stocks do not always generate positive returns. To put it another way, losses are a feature of investing in the markets and investors have to deal with them in a wise manner.

When a stock in an investor’s portfolio is at a huge loss it is not easy to recover the losses easily. If the percentage of loss is higher the percentage of gains required to break even is even higher. For example, if a stock goes from $10 to $5 that is 50% loss. However an investor has to earn more than 50% to get to the break even price of $10. It is not enough for the stock to recover by exactly 50% to reach the break even price of $10. A 50% rise would put the price at just $7.50 ($5 + $2.50 (50% of $5). So to get to $10, the stock has to double or rise by 100%. This is where it gets tough to say the least. So the key point to remember is as the percentage of loss increases the percentage of gain required to get even increases exponentially.

The following neat chart shows this critical concept figuratively:

Click to enlarge

Source: It pays to stay invested, Northwest & Ethical Investments L.P.

Bitcoin: The Best Performing Asset Class So Far This Year

Bitcoin has soared more than 100% since the start of the year. Yesterday its price crossed the $38,000 mark according to The Block as shown in the chart below. Bitcoin prices were around $16,600 in the beginning of the year.

Click to enlarge

Source: Bitcoin price breaks past $38,000, carried on by ETF hype, The Block

The following chart shows the development of Bitcoin YTD as per Google Finance:

Click to enlarge

Source: Google Finance

The following table shows bitcoin historical annual returns from 2010 to 2023:

Click to enlarge

Source: @CharlieBilello via syz Group

Disclosure: No positions

Calendar Year S&P 500 Index Returns 1928-2022: Chart

I have written many times in the past that investors should keep their long-term goals in mind and not worry too much about short-term gyrations of the market. While markets may be down one year they can come back roaring the next year. For instance, the S&P 500 was down over 20% in 2022 but this year it has recovered strongly. The following chart shows the importance of the need to maintain a long-term view with equity investing. The annual returns of the S&P 500 index from 1928 to 2022 shows that the returns were positive 73% of the time and negative only 27% of the time. In addition, when returns where positive it was more than 10% in majority of the years shown.

Click to enlarge

Source: 10 things every investor should know about investing workbook, John Hancock Investments

Related ETFs:

  1. SPDR S&P 500 ETF (SPY)
  2. iShares Core S&P 500 ETF (IVV)
  3. Vanguard S&P 500 ETF (VOO)
  4. SPDR Portfolio S&P 500  ETF (SPLG)

Disclosure: No positions