I have written many times in the past that investors should keep their long-term goals in mind and not worry too much about short-term gyrations of the market. While markets may be down one year they can come back roaring the next year. For instance, the S&P 500 was down over 20% in 2022 but this year it has recovered strongly. The following chart shows the importance of the need to maintain a long-term view with equity investing. The annual returns of the S&P 500 index from 1928 to 2022 shows that the returns were positive 73% of the time and negative only 27% of the time. In addition, when returns where positive it was more than 10% in majority of the years shown.
Click to enlarge
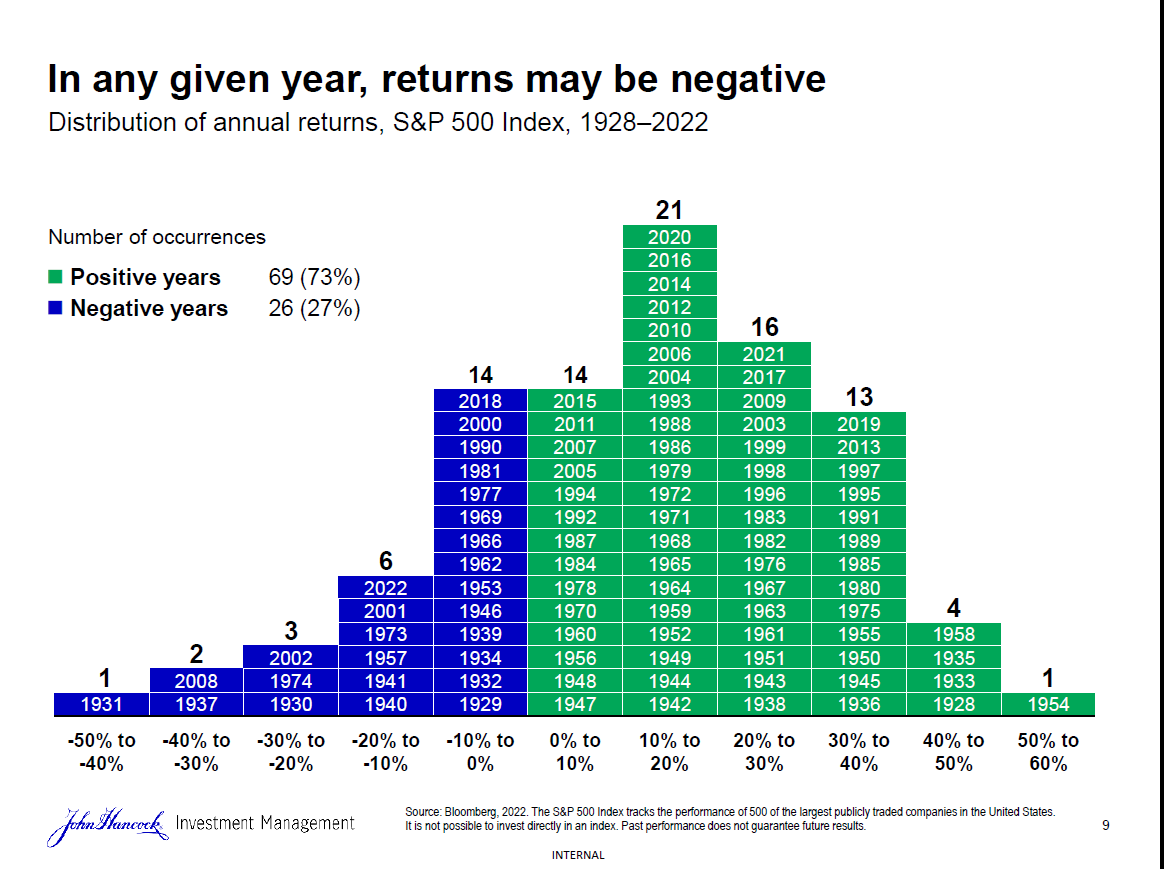
Source: 10 things every investor should know about investing workbook, John Hancock Investments
Related ETFs:
- SPDR S&P 500 ETF (SPY)
- iShares Core S&P 500 ETF (IVV)
- Vanguard S&P 500 ETF (VOO)
- SPDR Portfolio S&P 500 ETF (SPLG)
Disclosure: No positions