One of the topics that I have written about many times in the past is the importance of long-term investing. In the short term markets tend to be volatile for any number of reasons. Ignoring these volatilities and the noise that go with them is the key for success. Bull markets tend to be longer and stronger than bear markets. This is true not just with US markets but also with other developed markets as well. My posts on the bull and bear markets in the US can be found here and here. This concept applies to the Australian market as well as discussed here.
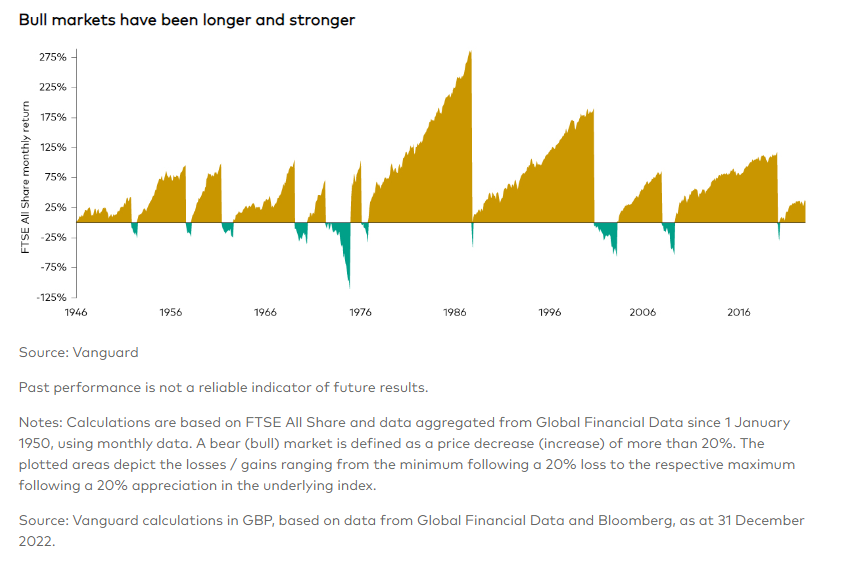
The UK equity markets follows a similar trajectory also as shown in the below chart from Vanguard. The bull and bear market in the UK market from 1946 to 2022:
Click to enlarge
Source: Staying the course during market uncertainty by James Norton, Vanguard UK
An excerpt from the article:
Long-term perspective
It is also worth bearing in mind that while bear markets – defined as experiencing a fall of more than 20% in share prices – are indeed challenging, historically they have been short-lived in comparison to the longer-term growth that global stock markets have delivered.The chart below shows that over the past 70 years, the average bull market – when share prices rise by 20% or more – has returned 120% and lasted around six and a half years. Meanwhile, the average bear market has lasted just over a year and returns have fallen 43%.
He also noted the following:
“If you miss the bad days, the chances are you’ll miss the good ones as well.”
This is absolutely true indeed regardless of which developed market an investor invests in.
Related ETF:
- iShares MSCI UK ETF (EWU)
Disclosure: No Positions
